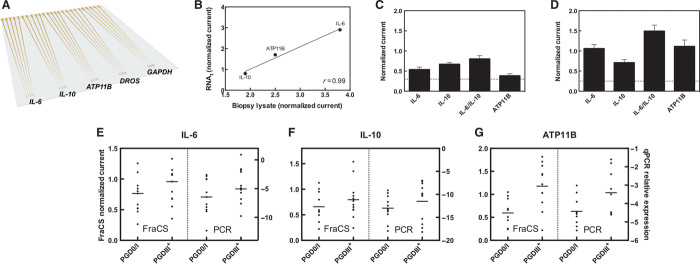
Fig. 4. Lung assessment chip and analysis of lung tissue.
(A) A multiplexed chip that could accommodate the parallel analysis of the five markers tested as proof of principle was prepared. (B) Correlation of signals obtained from purified RNA from a lung biopsy versus unpurified lysate of the same biopsy (r indicates Pearson’s correlation coefficient). (C) Representative data obtained from a good-outcome lung. (D) Representative data obtained from a poor-outcome lung. The signals are normalized to GAPDH controls, and the nonspecific D. melanogaster signal is shown as a dashed line. Data represent n = 15 different sensors. Columns represent mean, and error bars correspond to SEM. (E to G) Comparison of the FraCS assay response (left y axis) to qPCR expression levels (right y axis) of the same biopsy [PGD0/I (n = 9 to 11), PGDIII+ (n = 9 to 12)] run on both platforms for (E) IL-6, (F) IL-10, and (G) ATP11B.

