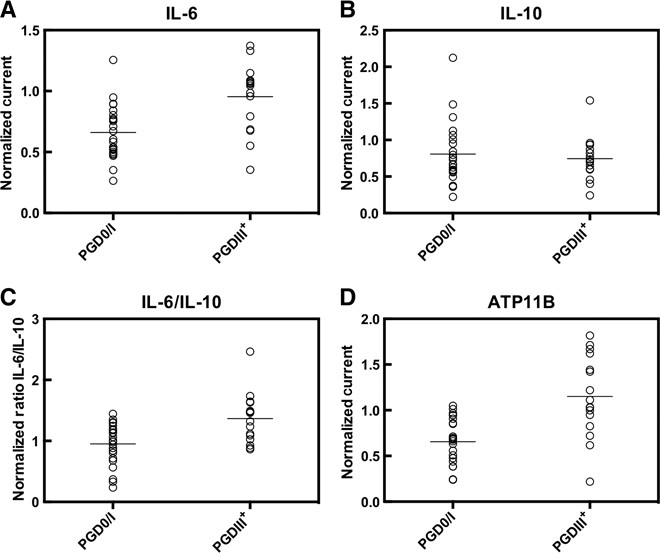
Fig. 5. Relative expression of LTx biomarkers.

(A to D) Each circle represents the LTx biomarker signal normalized to GAPDH for an individual donor lung, and horizontal lines show the population means of PGD0/I (n = 23) and PGDIII+ (n = 16) donor lungs for (A) IL-6, (B) IL-10, (C) IL-6/IL-10, and (D) ATP11B. Data were analyzed by a two-tailed Mann-Whitney test. The P values of each comparison are as follows: IL-6, 0.0007; IL-10, 0.9833; IL-6/IL-10, 0.0027; and ATP11B, 0.0002.
