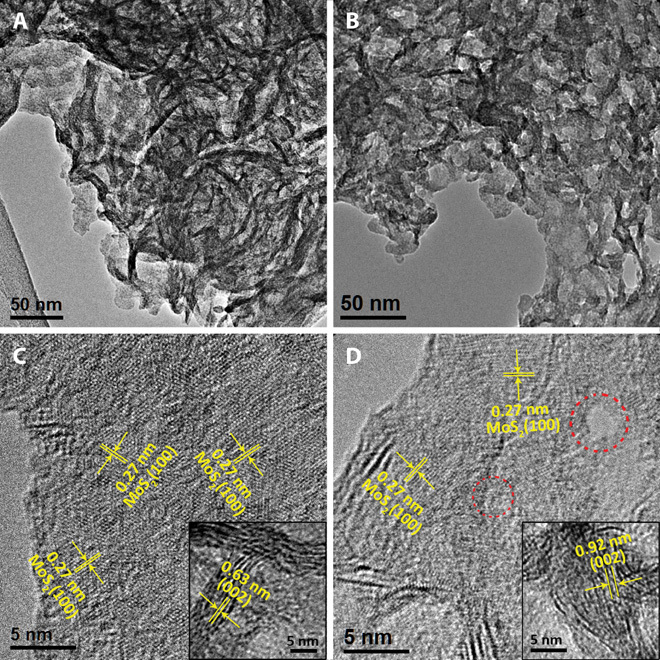
Fig. 4. TEM images.

(A and B) Low-magnification TEM images of (A) MoS2/C and (B) Ni-Mo-S/C (1:1). (C and D) HRTEM images of (C) MoS2/C and (D) Ni-Mo-S/C (1:1). Insets: Corresponding cross-sectional HRTEM images. Dashed circles in (D) indicate the structure defects of Ni-Mo-S/C (1:1).
