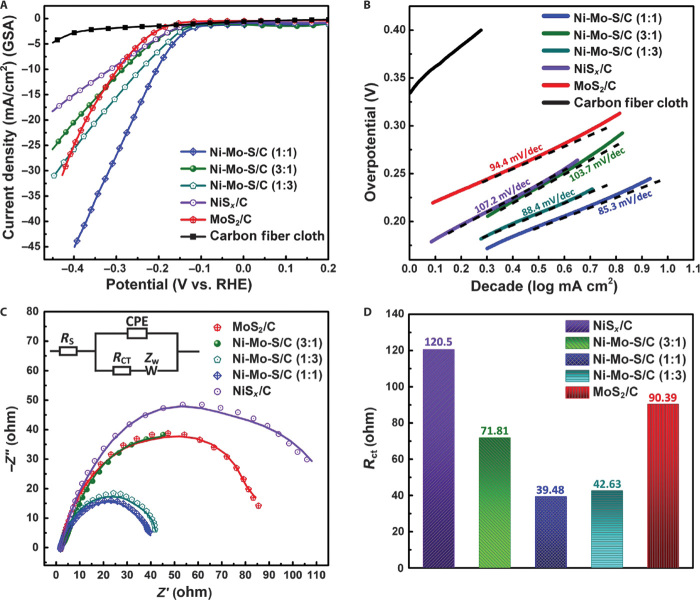
Fig. 8. Electrochemical performances.
(A) Polarization curves of carbon fiber cloth, NiSx/C, MoS2/C, and different Ni-Mo-S/C in neutral electrolyte. GSA, geometric surface area. (B) Corresponding Tafel plots obtained using slow-scan rate polarization curves. (C) Electrochemical impedance spectra of different electrodes at −0.3 V versus RHE. Inset: Equivalent circuit used for data analyses. CPE, constant-phase element; ZW, Warburg impedance. (D) Plot of charge transport resistance of different samples.

