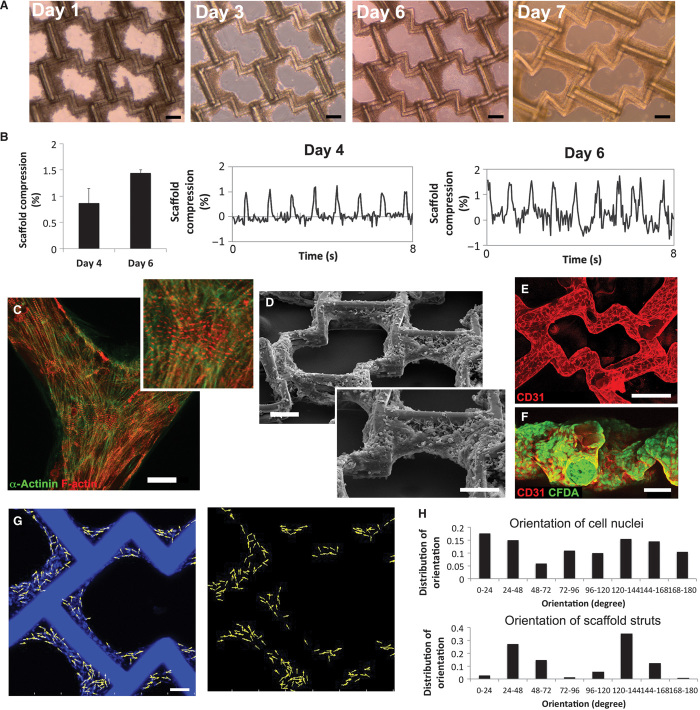
Fig. 3. Cardiac Tissue-Velcro characterization.
(A) Cardiac cell assembly around a mesh over 7 days. Scale bar, 100 μm. (B) Area decrease (%) during 1-Hz paced contraction derived from scaffold deformation increased from day 4 to 6 (day 4: 0.9 ± 0.3%, day 6: 1.4 ± 0.07%, mean ± SD, n = 3). Representative plots of electrically paced (1-Hz) cardiac tissue contracting and compressing the scaffold on days 4 and 6 of culture (n = 3). (C) Immunostaining of cardiac Tissue-Velcro on day 7 with sarcomeric α-actinin (red) and F-actin (green) (n = 4). Scale bar, 30 μm. (D) SEM of a Tissue-Velcro showing tissue bundles (day 7); scale bar, 100 μm. Inset, high-magnification SEM of a segment of Tissue-Velcro; scale bar, 100 μm. (E) EC coating around 7-day-old cardiac tissue grew to confluence in 24 hours (CD31, red). Scale bar, 100 μm. (F) CFDA cell tracker (green)–labeled endothelial cells; scale bar, 50 μm. (G) Representative images of nuclear staining (DAPI, blue) overlaid with nuclear orientation vectors along the long nuclear axis (n = 3). Scale bar, 50 μm. (H) Normalized distribution of orientation angles for cell nuclei and scaffold struts, respectively (representative trace of n = 3).

