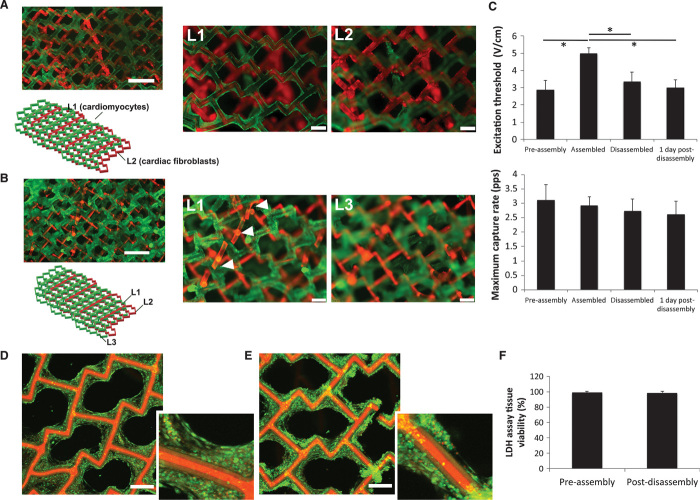
Fig. 4. Tissue function and viability upon assembly and disassembly.
(A) Coculture conditions were instantaneously established in the z direction by assembling two layers of Tissue-Velcro (day 7): one consisting of cardiac FBs (red) and the second consisting of CMs (green). Scale bar, 800 μm. Tissue interlocking was visualized with high-magnification fluorescent images focusing on layer 1 (L1) and layer 2 (L2). Scale bar, 200 μm. (B) Assembly into a three-layer CM tissue construct. Scale bar, 800 μm. High-magnification fluorescent images focused on L1 and L3 confirm Tissue-Velcro interlocking. Scale bar, 200 μm. Arrowheads point to T-shaped microhooks protruding from the middle layer (L2) into the top layer (L1). (C) Electrical excitability parameters of the cardiac Tissue-Velcro (day 7) before assembly (mean ± SD, n = 8), after assembly (two-layer, mean ± SD, n = 4), after disassembly (mean ± SD, n = 8), and 1 day after disassembly (mean ± SD, n = 8). (D and E) Viability staining of CM Tissue-Velcro (day 4) (D) before (n = 3) and (E) after the tissue assembly/disassembly process (n = 4). Scale bar, 200 μm. CFDA, green; propidium iodide (PI), red. Scaffold struts exhibit autofluorescence in the red channel. (F) Quantification of tissue viability from LDH activity in tissue culture media collected before (mean ± SD, n = 8) and after the tissue assembly/disassembly process (mean ± SD, n = 4).

