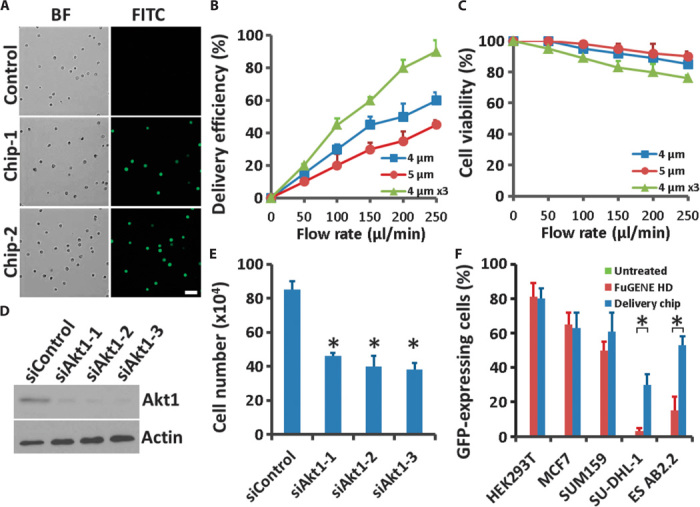
Fig. 2. Governing parameters and broad applicability.

(A) Microscopy of HEK293T cells into which FITC-labeled ssDNA was delivered through our chip. Results shown are from two independent chips. Control indicated all the same treatments for the cells except passing through the chip. Scale bar, 50 μm. BF, bright field. (B and C) Delivery efficiency (B) and cell viability (C) 16 hours after treatment were calculated for (A) as a function of fluid speed at different parameter designs; 4 or 5 μm indicates the constriction width, and 4 μm ×3 indicates cells passing through the same device three times. Error bars indicate SEM (n = 3). (D) Western blotting of PC-3 cells 48 hours after delivery with three different siRNA oligos targeting Akt1. Actin is showed as a loading control. (E) Cells from (D) were seeded in complete medium and, after 6 days, were recovered and trypsinized to count the numbers with a Countess II FL Automated Cell Counter (Life Technologies). Error bars indicate SEM (n = 3). *P < 0.005 determined by Student’s t test. (F) Delivery efficiency in different cell lines. HEK293T cells, human luminal-like MCF7 and basal-like SUM159 breast cancer cells, human SU-DHL-1 anaplastic large cell lymphoma cells, and mouse AB2.2 embryonic stem cells were delivered with plasmids encoding GFP. Untreated serves as a negative control and FuGENE HD serves as a positive control. Error bars indicate SEM (n = 3). *P < 0.005 determined by Student’s t test.
