
Fig. 2. NO2 column densities over 16 cities in the Middle East.
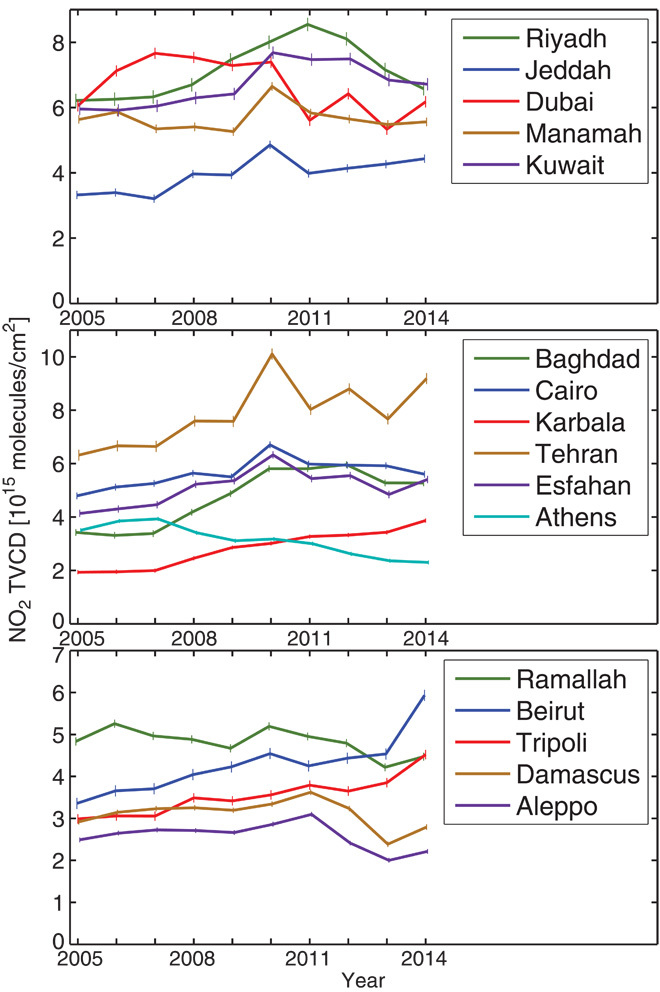
Annual mean NO2 during 2005–2014, indicating NOx emission trend changes around 2010. Vertical bars represent the SEM.
Official websites use .gov
A
.gov website belongs to an official
government organization in the United States.
Secure .gov websites use HTTPS
A lock (
) or https:// means you've safely
connected to the .gov website. Share sensitive
information only on official, secure websites.
Annual mean NO2 during 2005–2014, indicating NOx emission trend changes around 2010. Vertical bars represent the SEM.