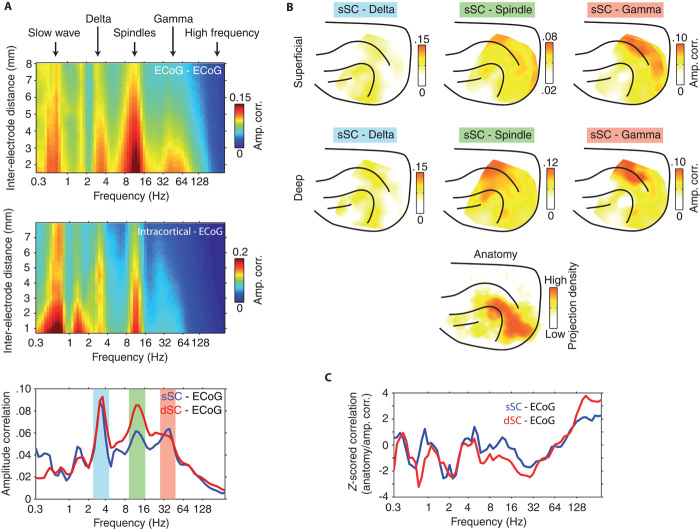
Fig. 2. Dynamics and large-scale topography of cortico-cortical and cortico-tectal amplitude envelope correlation.
(A) Top: Population-averaged amplitude envelope correlation computed between μECoG contact pairs separated by varying distances. Note that correlations are widely distributed in slow (~0.7 Hz), delta (~3 Hz), and spindle (8 to 15 Hz) frequency ranges and that amplitude envelopes are minimally correlated for frequencies above 120 Hz. Middle: Population-averaged amplitude envelope correlation computed between intracortical and μECoG recording sites. Bottom: Population-averaged cortico-tectal amplitude envelope correlation computed for SC recording contacts located in superficial (blue) and deep (red) SC layers. Note the peaks in cortico-tectal amplitude correlation for delta, spindle, and gamma frequencies. (B) Average cortical topography of cortico-tectal amplitude correlation for delta, spindle, and gamma (30 to 45 Hz) carrier frequencies. Maps are plotted for both superficial and deep SC layers. To compare functional coupling to anatomy, we plotted the density of tectally projecting neurons across the cortical surface. Anatomical data were adapted with permission from Fig. 1 in (13). (C) Spatial correlation of anatomical connectivity (B, bottom) and functional coupling topographies across all frequencies. The z score of correlation coefficients was estimated by computing the spatial correlation of randomly scrambled amplitude correlation topographies and anatomical data. Analyses for superficial and deep layers are plotted in blue and red, respectively.

