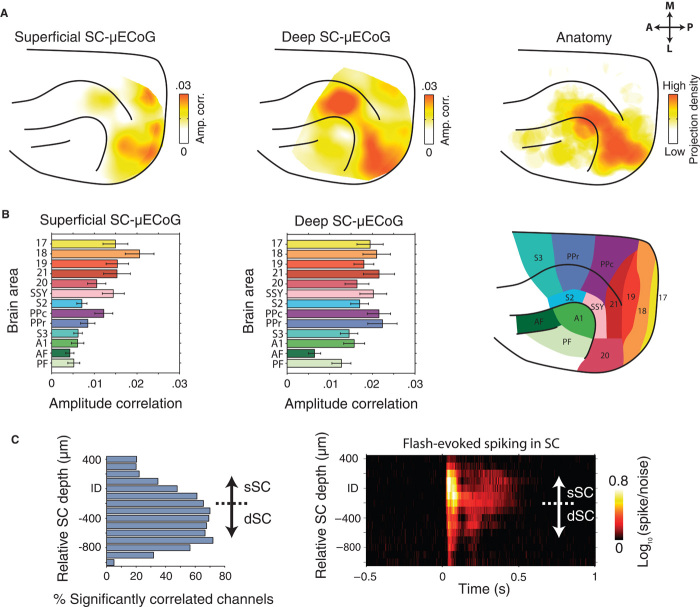
Fig. 4. Large-scale topography of high-frequency cortico-tectal amplitude envelope correlation.
(A) Left: Average cortical topography of LFP amplitude correlation between superficial SC and μECoG array. Note the strongest amplitude correlation over posterior visual cortex. Middle: Average cortical topography of deep SC to μECoG LFP amplitude correlation. Note the presence of strong amplitude correlation in visual and suprasylvian cortical areas. Amplitude correlation effects extend anterior-medially along the suprasylvian gyrus toward a separate cluster of strong correlation in suprasylvian cortex. Right: Plot of the density of tectally projecting neurons across the cortical surface. Data were adapted with permission from (13). (B) Population-averaged (±SEM) strength of superficial SC-μECoG (left) and deep SC-μECoG (middle) high-frequency amplitude envelope correlation for different cortical areas. A map of the areal parcellation used in this analysis is shown on the right. Note the presence of strong correlation in early visual cortical areas for superficial SC-μECoG channel pairs. In contrast, deep SC-μECoG amplitude correlation was more widespread, encompassing visual, suprasylvian, and posterior parietal areas. (C) Left: Incidence of significant SC-μECoG high-frequency amplitude correlation as a function of SC depth. Right: Population-averaged spike/noise ratio in response to visual flash stimulation (flash onset at 0 s). Note that significant amplitude correlation with cortex was most prominent in intermediate/deep SC layers.

