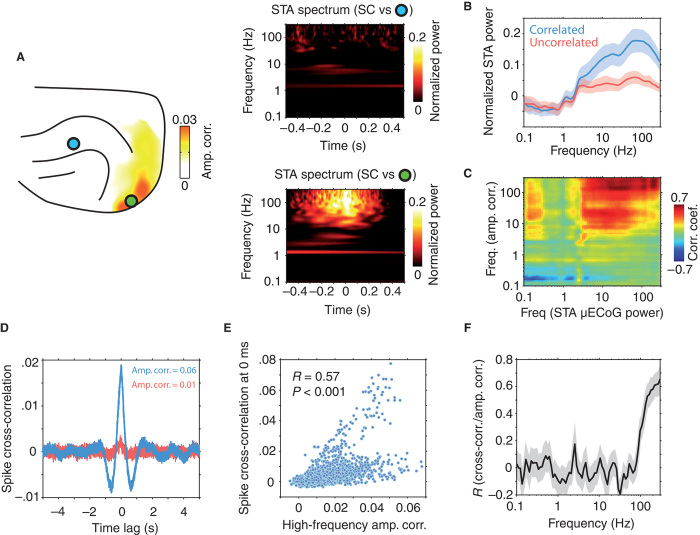
Fig. 5. High-frequency amplitude envelope correlation reflects synchronized cortico-tectal spiking activity.
(A) SC STA spectrograms for two different μECoG contacts from an example recording session. The location of the contacts is shown in the panel on the left. Both spectrograms were computed using spiking data from the same SC seed contact. The strength of cortico-tectal amplitude correlation for the SC seed electrode is displayed as a heat map. Note the presence of an increase of μECoG signal power for frequencies above 20 Hz time-locked to SC spiking activity for the channel pair that showed strong power correlation (right, bottom panel). In contrast, the weakly correlated channel pair displayed no spike-triggered change in signal power (right, top panel). (B) Population mean (±SD) STA spectrograms. SC-μECoG channel pairs displaying significant high-frequency amplitude correlation are plotted in blue, whereas all others are plotted in red. (C) Correlation of amplitude envelope coupling and STA power for all frequency-frequency combinations. Note that high-frequency coupling is correlated to the strength of STA signals in frequencies above ~3 Hz. (D) Example spike cross-correlation histograms for SC-intracortical channel pairs that displayed strong (blue) and weak (red) high-frequency amplitude envelope correlation, respectively. Note the large peak around ~0 ms for the correlated channel pair and the lack of structure for the uncorrelated channel pair. (E) Scatter plot of the strength of amplitude correlation plotted against the probability of synchronous spiking for all SC-intracortical channel pairs. The correlation coefficient and related P value are shown as an inset. (F) Correlation of amplitude envelope coupling and synchronized spiking activity as a function of frequency (±SD). Note that coupling in high LFP frequencies specifically correlates with synchronized cortico-tectal spiking activity.

