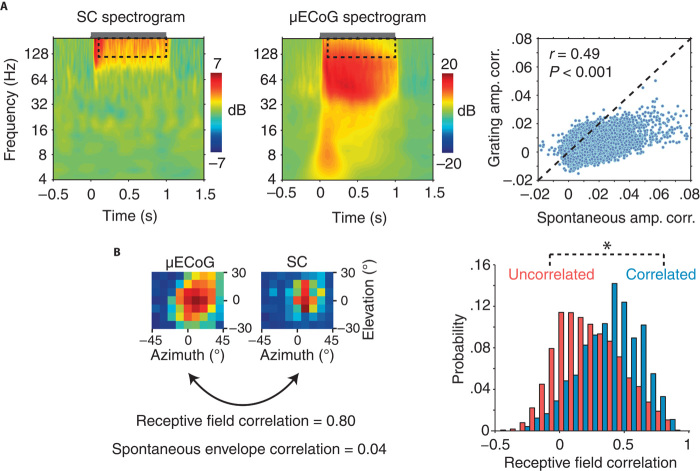
Fig. 6. Comparison of spontaneous and stimulus-induced high-frequency neural dynamics.
(A) Drifting grating induced power changes for representative SC (left) and μECoG (middle) recording sites. The gray bar above each spectrogram indicates the duration of drifting grating stimulation. Note the broadband increase in high-frequency power for both SC and μECoG recording sites. Right: A scatter plot of the strength of spontaneous SC-μECoG versus drifting grating-induced SC-μECoG high-frequency amplitude correlation. Note that most data points lie below the 1:1 line, indicating that SC-μECoG channel pairs display stronger amplitude correlation during spontaneous activity. (B) Left: μECoG and SC visual spatial receptive fields from one example recording session. Note that this SC-μECoG channel pair displayed considerable visual spatial receptive field overlap as well as strong high-frequency amplitude envelope correlation during spontaneous activity. Right: Histogram displaying the distribution of visual receptive field correlation for SC-μECoG channel pairs that displayed significant high-frequency amplitude correlation (blue) and insignificant correlation (red). *P < 0.01.

