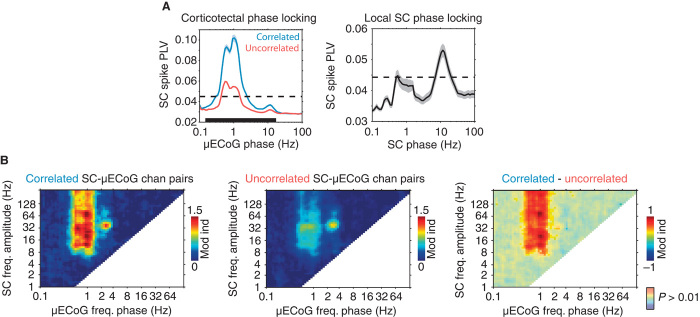
Fig. 7. The dynamics of spontaneous SC neural activity are dominated by the phase of slow and spindle oscillations.
(A) Population-averaged (±SEM) SC spike PLVs calculated using the phase of cortical (left) and local SC oscillations (right). The dashed line in each plot illustrates the level of significance (P < 0.01). For SC-μECoG channel pairs, significantly correlated and uncorrelated channel pairs are plotted separately. The black bar at the bottom of the SC-μECoG plot indicates the area in which correlated and uncorrelated curves are significantly different (P < 0.01). Note that spiking in amplitude-correlated channel pairs is more strongly locked to the phase of slow cortical oscillations. In addition, SC spiking activity is locked to the phase of local oscillations at the spindle frequency (~10 Hz). (B) Population-averaged cross-frequency phase-amplitude spectrograms calculated using the phase of μECoG oscillations and the amplitude of SC signals. Significantly correlated SC-μECoG channel pairs are shown on the left, uncorrelated channel pairs in the middle, and the difference between correlated and uncorrelated on the right. Note that SC-μECoG channel pairs that display strong high-frequency amplitude correlation also show significantly stronger coupling of SC oscillations above 8 Hz to the phase of slow cortical oscillations.

