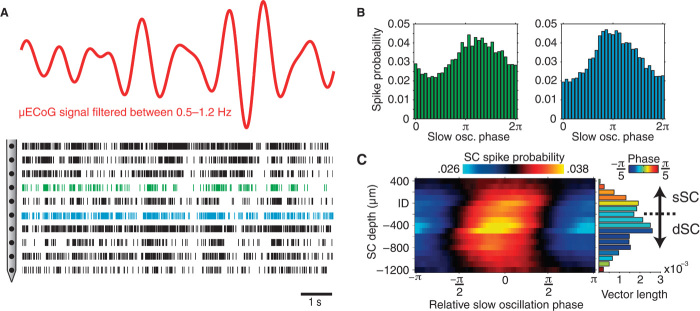
Fig. 8. The dependency of SC spiking activity to the phase of cortical slow oscillations.
(A) Example of μECoG signal filtered at the slow oscillation frequency with a raster plot containing spiking data from several SC channels. Note that the bursting behavior of SC neurons appears to be phase-locked to the trough of the filtered slow wave. (B) Spike-phase histograms for the two channels marked (blue and green) in (A). Note that neurons from the more superficial recording contact prefer a slightly earlier phase than the deeper recording contact. (C) Population-averaged spike-phase histogram as a function of SC depth. Histograms were compiled using SC spiking activity and the phase of μECoG slow oscillations, and centered on the slow oscillatory phase corresponding to cortical up states, where a relative phase of 0 indicates the center of the up state located close to the trough of cortical slow oscillations. The strength with which average spike-phase histograms across each SC depth deviate from a uniform circular distribution is shown as a bar plot to the right, where the color of each bar indicates the preferred phase at each depth. Note that spike-phase locking is strongest and occurs at the earliest phase in intermediate SC layers. From intermediate layers, both the strength of phase locking and phase lag decrease gradually with increasing distance in dorsal and ventral directions.

