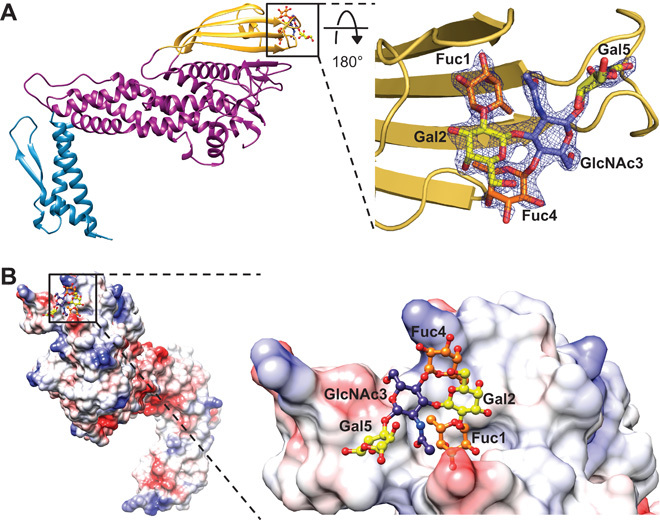
Fig. 2. The Leb binding site of BabA.

(A) Leb binds to BabA at one edge of the crown. The electron density map around Leb (2Fo − Fc map, contoured at 2.0σ) in complex with BabA is shown. (B) An electrostatic surface representation shows Leb binding to a shallow, solvent-exposed pocket at the tip of BabA containing charged and neutral patches. Fucose, galactose, and N-acetylglucosamine residues are colored orange, yellow, and blue, respectively.
