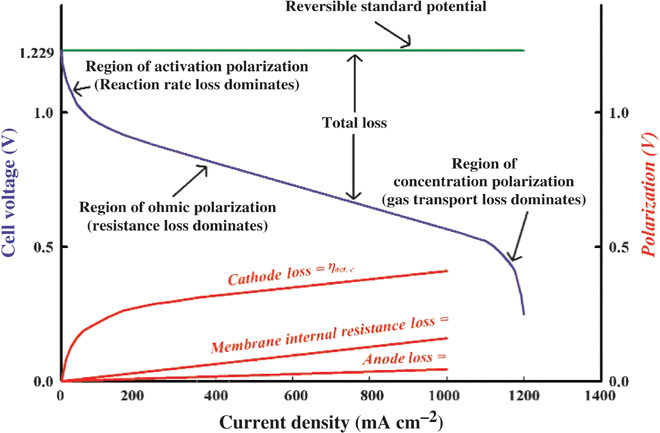
Fig. 2. Polarization curve of PEMFC.

The typical polarization curve describes the relationship between cell voltage and current density used to evaluate cell performance. The various losses are shown in the same figure, indicating different overpotential sources. [From V. Ramani, H. R. Kunz, J. M. Fenton, The polymer electrolyte fuel cell. Electrochem. Soc. Interface 13, 17 (2004). Reprinted with permission from the Electrochemical Society.]
