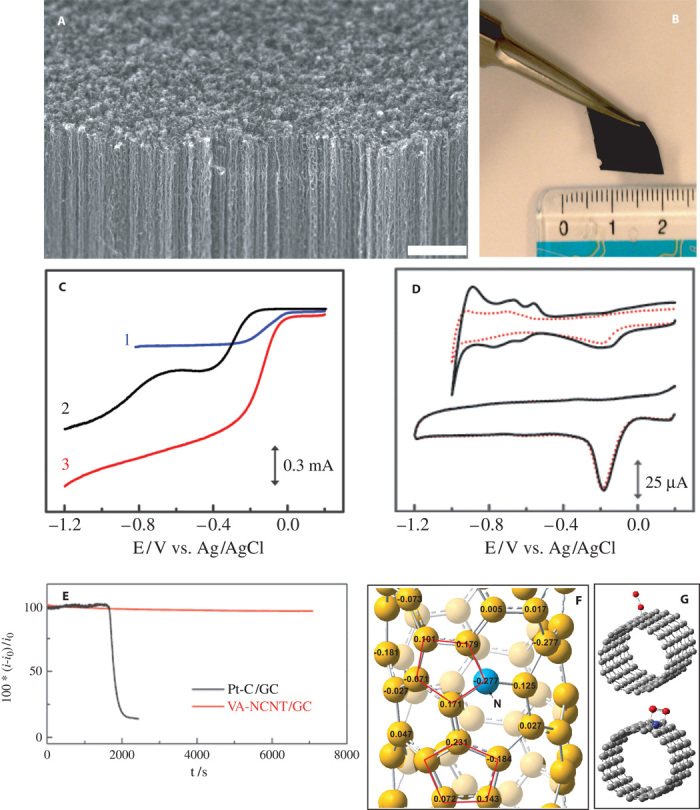
Fig. 4. Morphology characterization and catalytic performance of VA-NCNTs.

(A) Scanning electron microscopy image of the as-synthesized VA-NCNTs on a quartz substrate. Scale bar, 2 μm. (B) Digital photograph of the VA-NCNT array after having been transferred onto a polystyrene (PS) and nonaligned CNT conductive composite film. (C) RDE voltammograms for oxygen reduction in air-saturated 0.1 M KOH at the Pt/C (curve 1), VA-CCNT (curve 2), and VA-NCNT (curve 3) electrodes. (D) Cyclic voltammograms for the ORR at the Pt/C (top) and VA-NCNT (bottom) electrodes before (solid curves) and after (dotted curves) a continuous potentiodynamic sweep for about 100,000 cycles in air-saturated 0.1 M KOH at room temperature (25 ± 1°C). Scan rate: 100 mV s−1. (E) The CO poisoning effect on the i-t chronoamperometric response for the Pt/C (black curve) and VA-NCNT (red line) electrodes. CO gas (55 ml/min) was first added into the 550 ml/min O2 flow, and then the mixture gas of ~9% CO (v/v) was introduced into the electrochemical cell at about 1700s. (F) Calculated charge density distribution for the NCNTs. (G) Schematic representations of possible adsorption modes of an oxygen molecule at the CCNTs (top) and NCNTs (bottom). [From K. Gong, F. Du, Z. Xia, M. Durstock, L. Dai, Nitrogen-doped carbon nanotube arrays with high electrocatalytic activity for oxygen reduction. Science 323, 760–764 (2009). Reprinted with permission from AAAS.]
