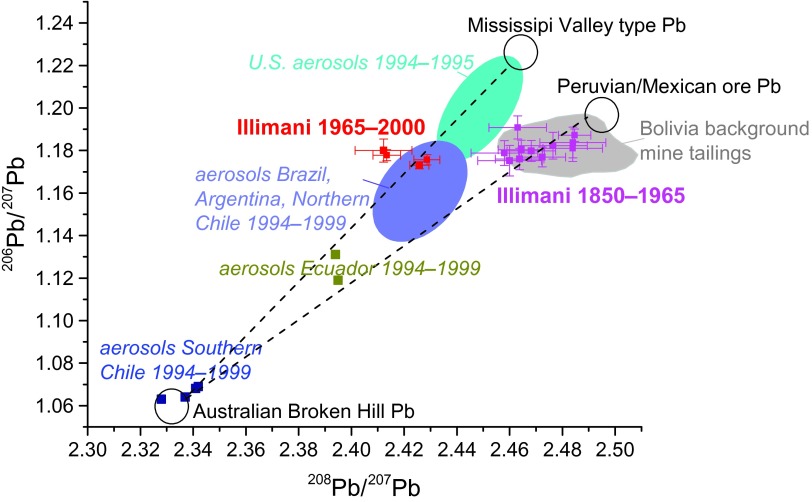
Fig. 6. Three-isotope plot of the Illimani Pb record for the period AD 1850–2000.
Ice core values are given as 10-year averages (±SE) for the periods AD 1850–1965 (pink) and AD 1965–2000 (red). The gray range represents the isotopic composition of background soils and dust in Bolivia and Porco and Cerro de Potosí mine tailings (42). The Pb isotopic composition of aerosols from South America and the United States in the period AD 1994–1999 (68) is shown in blue and green, respectively. The three black circles mark areas typical for Australian Broken Hill Pb used in European gasoline, Mississippi Valley–type Pb used in U.S. gasoline, and the composition of Peruvian/Mexican ores (68).

