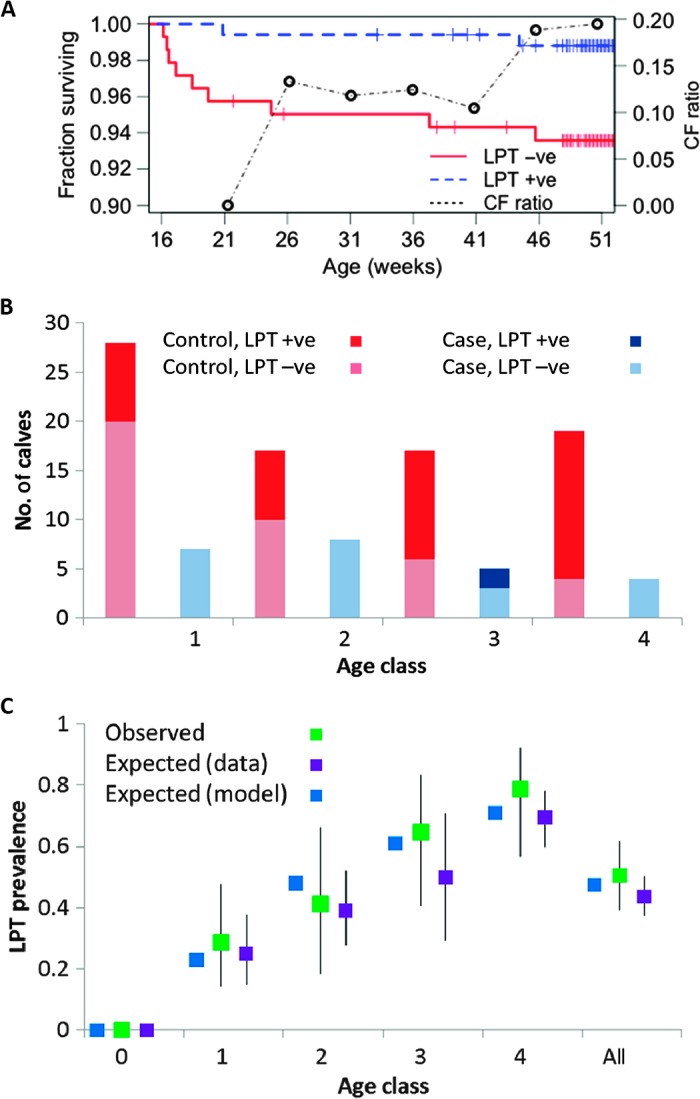
Fig. 3. Epidemiology of LPT infections and relationships with clinical outcome of T. parva infection.

(A) Kaplan-Meier plot for calves first infected by T. parva at >16 weeks of age. Observed fractions surviving for those initially exposed (n = 169) and unexposed (n = 141) to LPT are compared. Tick marks indicate censoring (due to non-ECF deaths or end of observation period). A log-rank test indicates a significant difference [χ2(1) = 6.2, P = 0.013]. The change in overall relative risk for the two groups (CF ratio) as the calves age indicates falling levels of protection and is consistent with model predictions (see table S2). (B) Numbers of case and control calves by age class (1 to 4; see Table 1) and detection or nondetection of LPT, having excluded five calves with unknown LPT status. Controlling for age, detection of LPT is significantly protective (odds ratio = 0.11, P = 0.002). (C) Comparison of observed age-related LPT prevalences at time of first detection of T. parva surviving case-control calves (n = 81) in different age classes and overall (with 95% CIs) with expected prevalences averaged over all visits when T. parva was not detected. Expected prevalences in surviving calves from a mathematical model (see main text) are compared.
