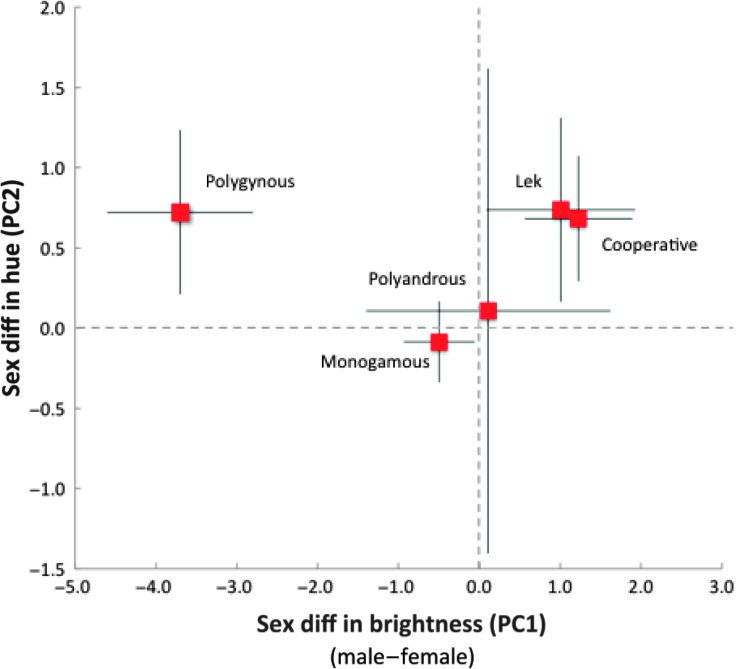
Fig. 2. Sexual dichromatism in brightness (PC1) and hue (PC2) in relation to mating system categories.
Mean (squares) and SE (lines) values are based on full phylogenetic generalized least squares (PGLS) models (table S3). Note that polygynous males were duller than females because many species had extensive black plumage (fig. S3).

