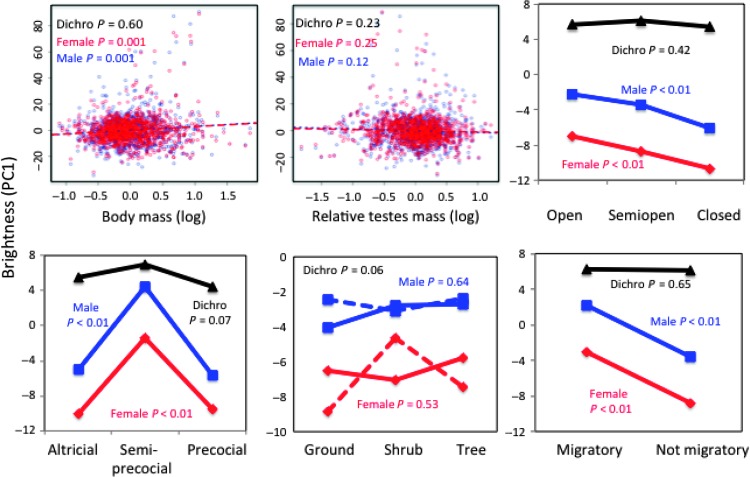
Fig. 3. Plumage brightness (PC1) for each sex in relation to morphological, ecological, and behavioral traits.
Mean and P values are based on full PGLS models (table S3). Regression lines from PGLS models are shown for each sex (males, blue; females, red) plotted against the original body and testes mass data. P values for nest height refer to interactions between nest height and male parental care [coded yes (solid line) or no (dashed line)]. Dichromatism is the sum of PC scores for males minus the sum for females.

