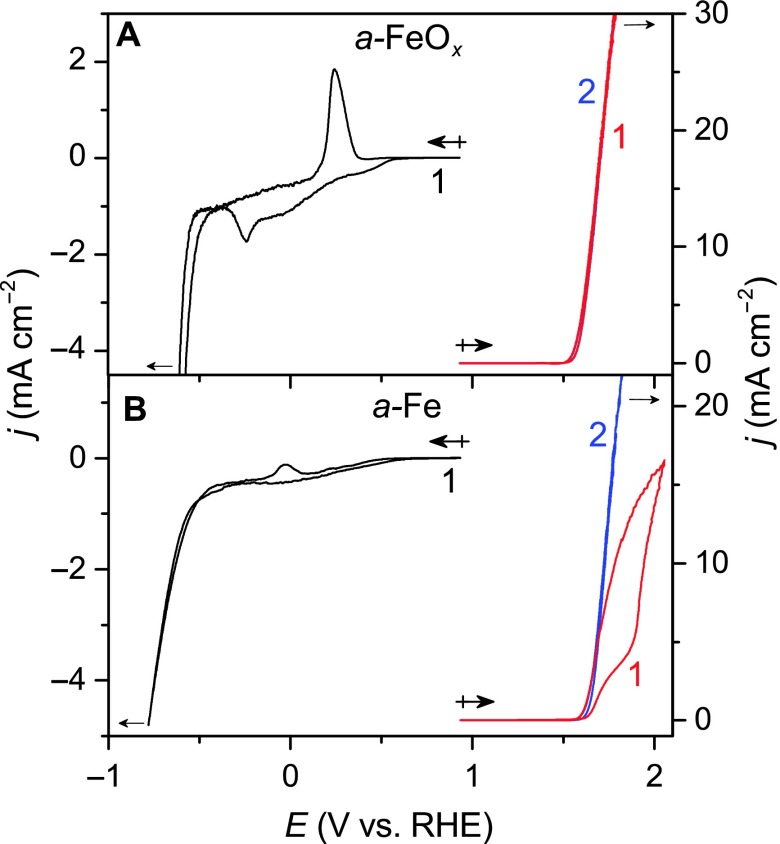
Fig. 2. Cyclic voltammograms for a-FeOx and a-Fe.
(A and B) Cyclic voltammograms for thin films of (A) a-FeOx and (B) a-Fe on FTO. Values indicate the sequence of the cycles that were recorded. (A) The oxidative sweep of a-FeOx leads to a sharp rise in current coincident with catalytic water oxidation, and subsequent cycles led to superimposable traces. (B) The oxidative sweep for a-Fe featured a markedly different current profile for the first cycle; however, subsequent cycles indicated that a-Fe was converted to a-FeOx upon oxidation on the basis of the superimposable scans. The differences in the reductive behavior were more stark, and the cathodic peak at −0.25 V for (A) a-FeOx was not detected for (B) a-Fe before HER catalysis, indicating a more reduced form of iron for (B). Experimental conditions: counter electrode = Pt mesh; reference electrode = Ag/AgCl, KCl (sat’d); scan rate = 10 mV s−1; electrolyte = 0.1 M KOH (aq).

