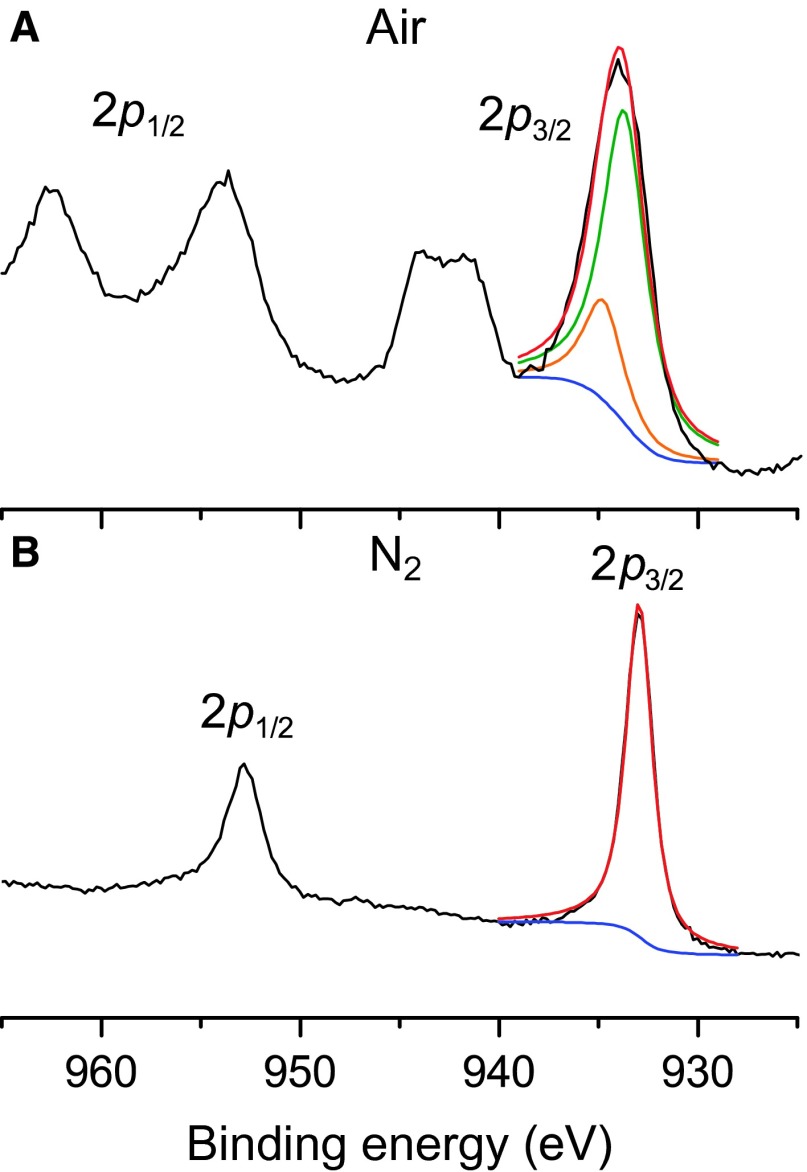
Fig. 4. XPS spectra of the copper 2p3/2 region.
(A and B) Fitting of the copper 2p3/2 region of XPS recorded on thin films of Cu(eh)2 on FTO after being subjected to the NIRDD process under (A) air and (B) nitrogen, respectively. Sums of the fitting components are indicated (red traces). Fitting of the data used center-of-gravity peaks for (A) Cu(O) (green) and Cu(OH)2 (orange), and (B) Cu(I)/Cu(0) (green). Signature copper(II) satellite peaks present in (A), but not in (B), confirm a more reduced form of the film when prepared under nitrogen. The computed baselines are indicated in blue.

