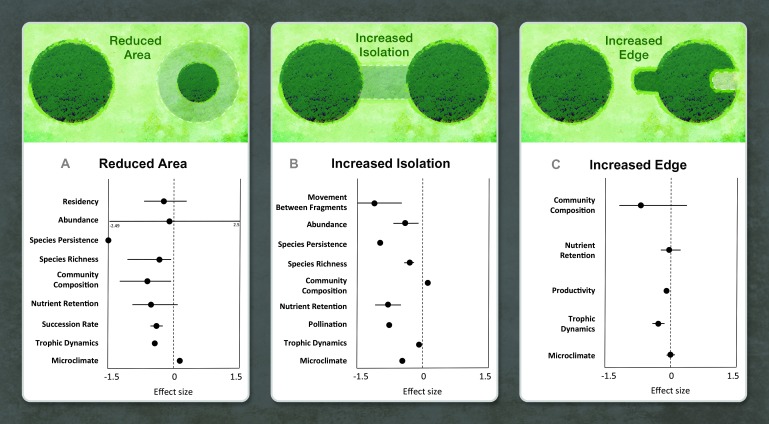
Fig. 3. Fragmentation effects propagate through the whole ecosystem.
(A to C) For each fragmentation treatment [reduced area in BDFFP, Wog Wog, Kansas (A); increased isolation in SRS and Moss (B); and increased edge in all experiments (C)], we summarize major findings for ecological processes at all levels of ecological organization. Each dot represents the mean effect size [computed as log response ratio: ln(mean in more fragmented treatment/mean in non- or less-fragmented treatment)] for an ecological process. Effect sizes are statistical, such that negative or positive values could represent degrading function. Horizontal bars are the range when a dot is represented by more than one study. Details, including individual effect sizes for each study, are reported in table S1.

