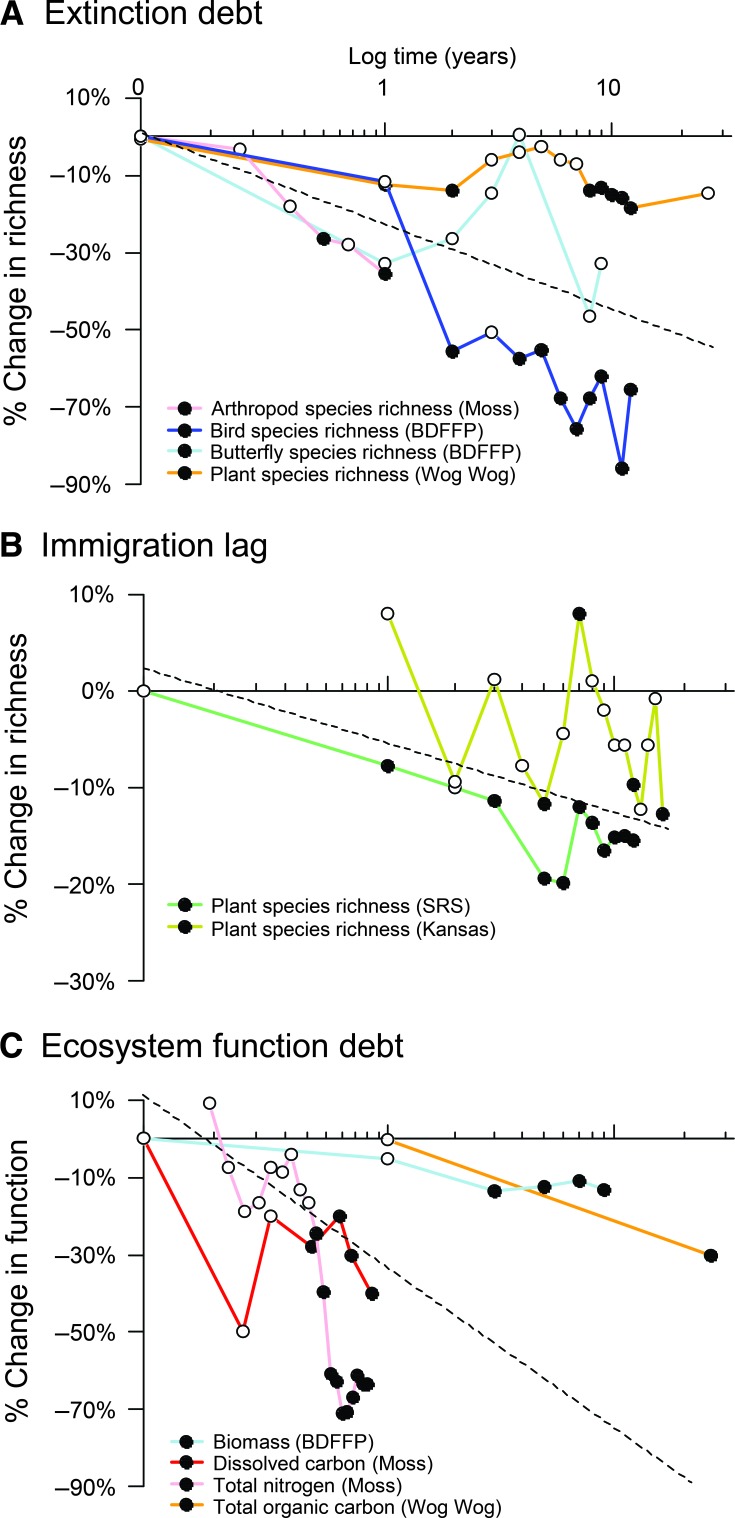
Fig. 4. Delayed effects of fragmentation on ecosystem degradation.
(A) The extinction debt represents a delayed loss of species due to fragmentation. (B) The immigration lag represents differences in species richness caused by smaller fragment area or increased isolation during fragment succession. (C) The ecosystem function debt represents delayed changes in ecosystem function due to reduced fragment size or increased isolation. Percent loss is calculated as proportional change in fragmented treatments [for example, (no. of species in fragment − no. of species in control)/(no. of species in control) × 100]. Fragments and controls were either the same area before and after fragmentation, fragments compared to unfragmented controls, or small compared to large fragments. Filled symbols indicate times when fragmentation effects became significant, as determined by the original studies (see table S2). Mean slopes (dashed lines) were estimated using linear mixed (random slopes) models. Mean slope estimates (mean and SE) were as follows: (A) −0.22935 (0.07529); (B) −0.06519 (0.03495); (C) −0.38568 (0.16010).

