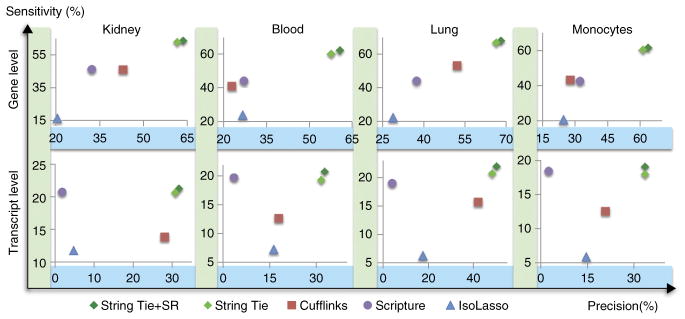
Figure 3.
Accuracy of transcript assemblers at assembling known genes, measured on real data sets from four different tissues. Known genes are defined as those annotated in either the RefSeq, UCSC or Ensembl human gene databases. Gene level sensitivity (y axis) measures the percentage of genes for which a program got at least one isoform correct, whereas transcript sensitivity measures the percentage of known transcripts that were correctly assembled. Precision (x axis) is measured as the percentage of all predicted genes (transcripts) that match an annotated gene (transcript).

