
Figure 3. Remodeling of the Proteostasis Network During Aging.
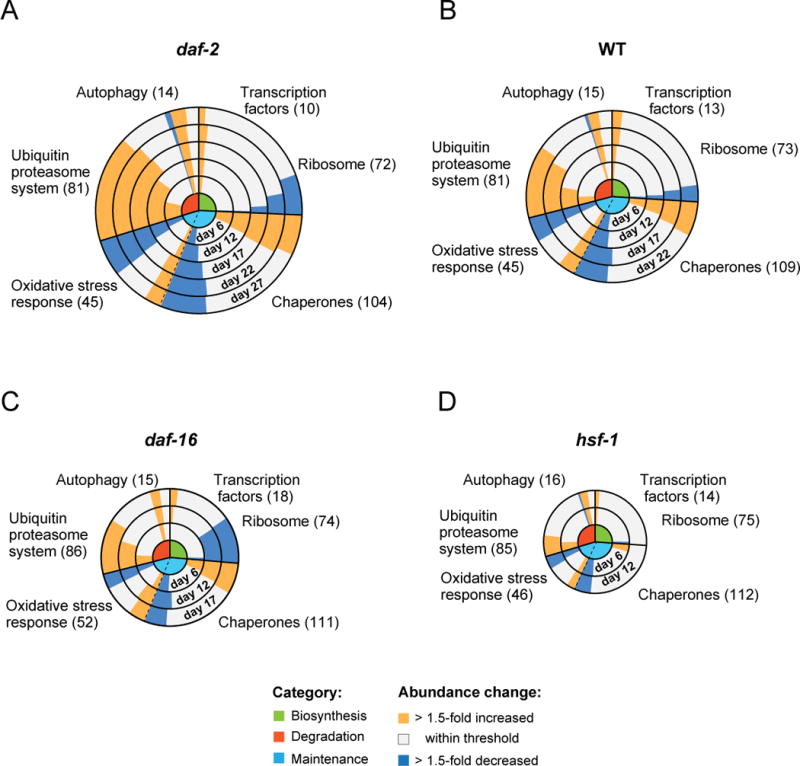
(A–D) Abundance changes in components of the PN (see Figure S2A) during aging in daf-2 (A), WT (B), daf-16 (C) and hsf-1 (D) mutant worms. Concentric circles represent increasing age in days from center to periphery. Circle size corresponds with lifespan. Functional categories of components are indicated in the center: green, biosynthesis; red, degradation; light blue, conformational maintenance (see Figure S2A). Abundance changes of components within these categories relative to day 1 of each strain (yellow, >1.5-fold up; blue, >1.5-fold down) are indicated as bars, with the length of the bar representing the number of proteins undergoing change. The total number of proteins quantified in the respective categories are indicated.