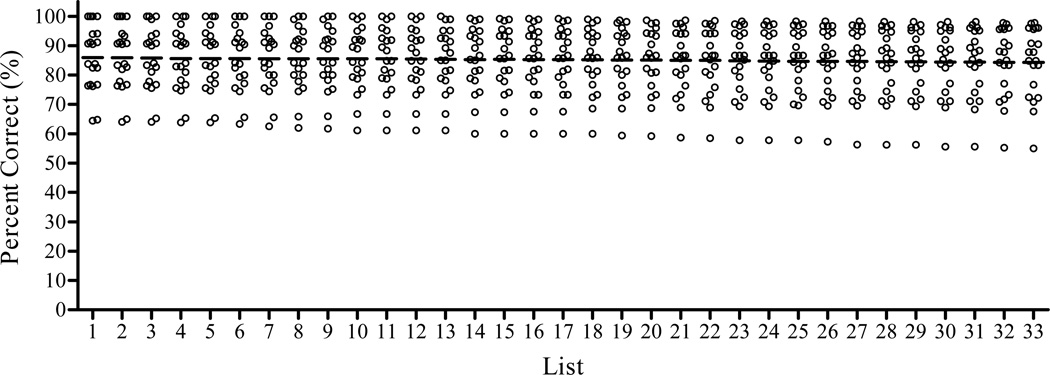
Figure 1.
Intelligibility estimates of the 33 sentence lists. Symbols represent the mean percent correct score of a single sentence presented to 15 normal-hearing subjects listening to a 5-channel cochlear implant simulation. The mean percent correct score for each list is indicated by a horizontal bar.

