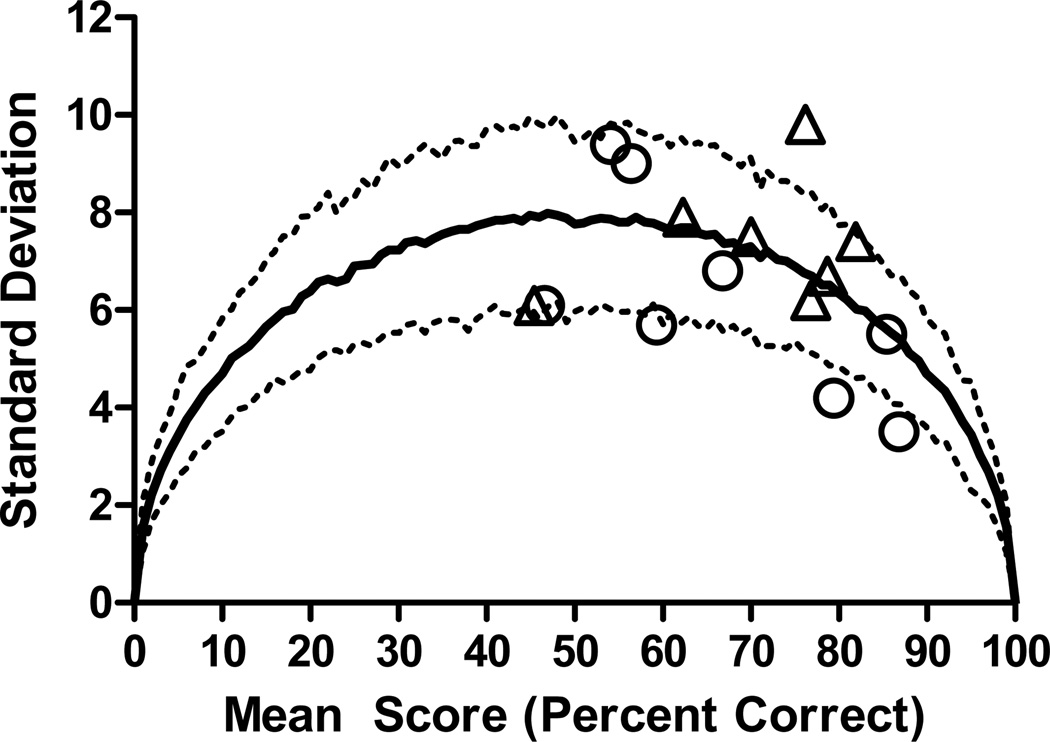
Figure 4.
Predicted variability of materials as a function of the mean percent correct scores. The predicted standard deviation (solid line) and 95% confidence intervals (dashed lines) are based on 29 list scores, with each list containing 40 items. Symbols represent the mean and standard deviation of scores from 15 cochlear implant listeners on 29 lists of AzBio sentences. For each subject, all lists were presented in quiet (circles) or in noise at a single signal-to-noise ratio (triangles) to prevent ceiling or floor effects.

