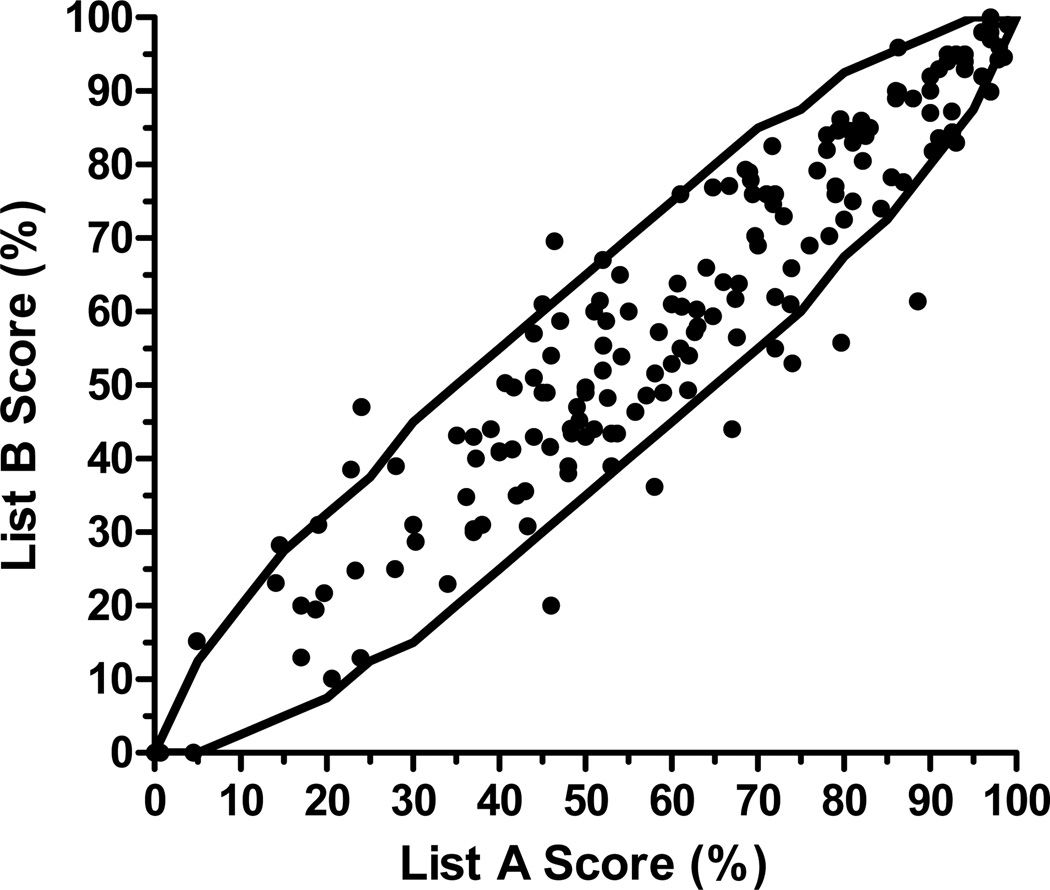
Figure 5.
Comparison of 172 instances where individual cochlear implant listeners (n=66) were tested on two lists within the same listening condition. Solid lines represent the upper and lower 95% confidence intervals for single list comparisons. Symbols represent scores on the first (A) and second (B) list tested within the same condition. Scores falling outside of the 95% confidence interval would be incorrectly labeled as significantly different.

