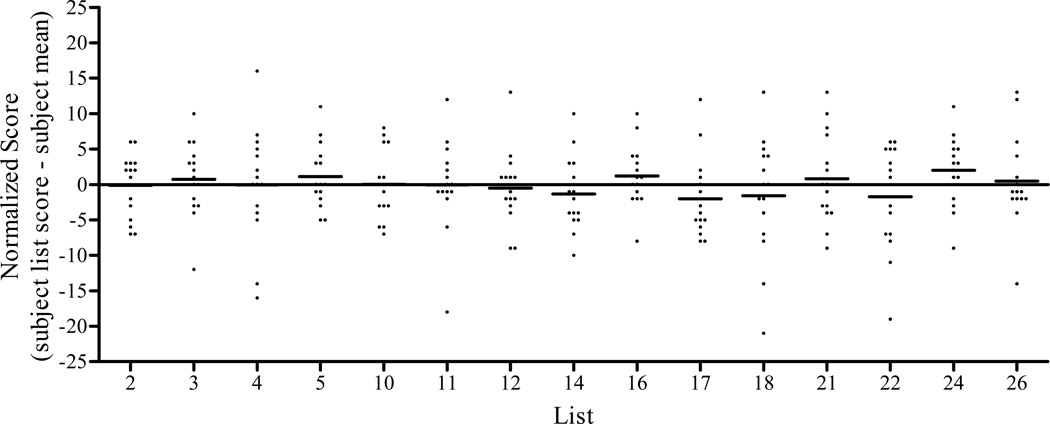
Figure 6.
Normalized scores for 15 CI listeners on the 15 sentence lists included in the AzBio Sentence Test. Symbols represent an individual listener’s list score relative to their mean level of performance on all 15 lists. Positive values indicate better than average performance and negative values indicate below average performance. The average normalized score for each list is shown as a horizontal bar.

