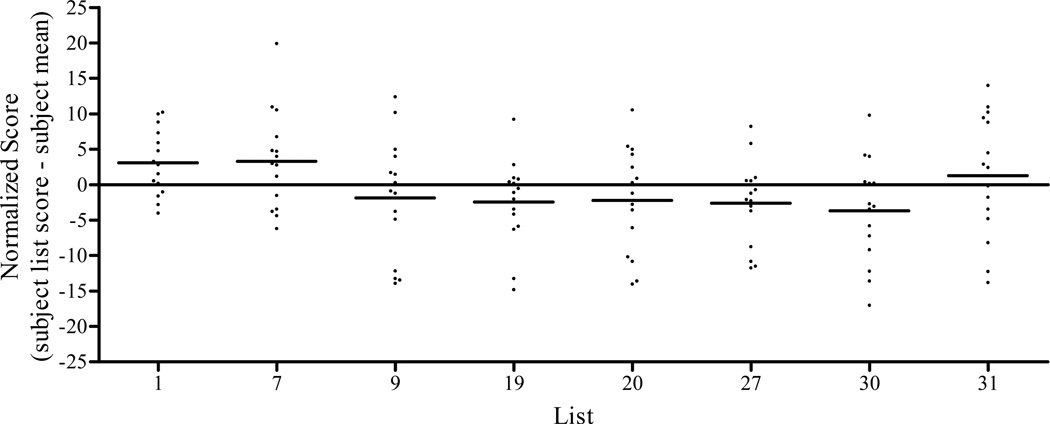
Figure 7.
Normalized scores for 15 CI listeners on the 8 sentence lists included in the Minimum Speech Test Battery. Symbols represent an individual listener’s list score relative to their own mean level of performance on the 8 lists. Positive values indicate better than average performance and negative values indicate below average performance. The average normalized score for each list is shown as a horizontal bar.

