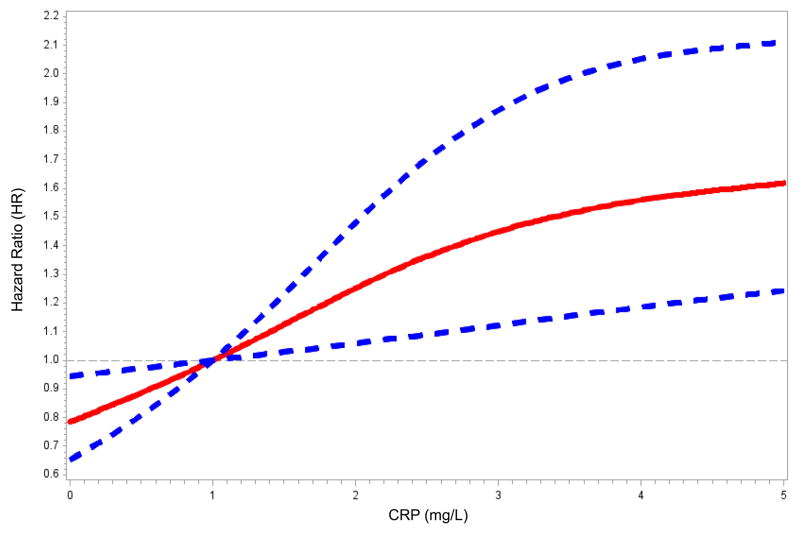
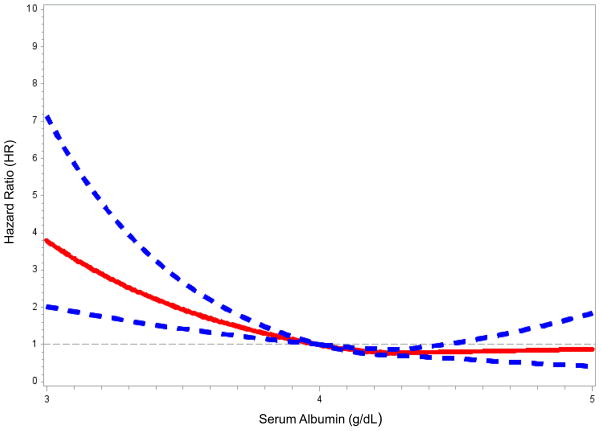
Figure 1.
Restricted cubic spline modeling of C-reactive protein (CRP) and serum albumin with VTE. Restricted cubic spline functions were analyzed with knots located at quartiles of the population distribution for (A) CRP (25th %: 0.94 mg/L; 50th %: 2.17 mg/L; and 75th %: 4.96 mg/L) with the reference category set at 1 mg/L; and, (B) serum albumin (25th %: 4.0 g/dL; 50th %: 4.2 g/dL; and 75th % 4.4 g/dL) with the reference category set at 4.0 g/dL. Solid lines represent hazard ratios; dashed lines represent 95% confidence intervals. Analyses were adjusted for age, sex, race, region, and race*region interaction.


