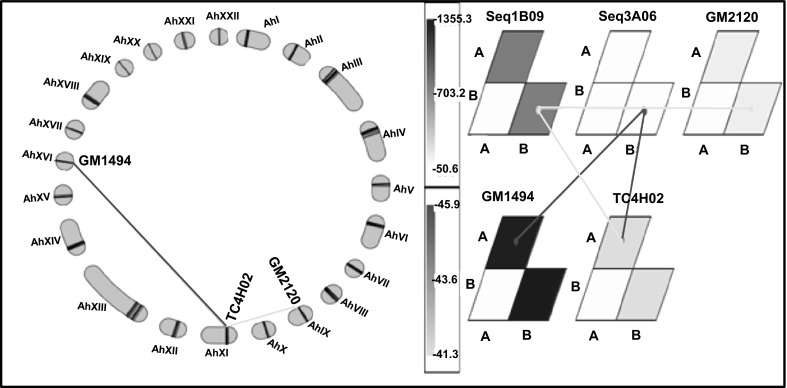
Fig. 5.

Epistasic QTLs (E-QTLs) for the pod yield detected at Sadore in 2009 using genotyping mapping matrix program. This figure shows the three-loci interaction detected for pod yield at Sadore in 2009. a Linkage groups are arranged tandemly as a circle and triangles in the circle represent interaction of three loci combination. b Graphical presentation of interacting loci and allele type by genotype matrices (GMs) and a genotype matrix network (GMN). Significant locus/allele combinations of three interacting loci are shown by GMs and GMN. Matrices and connecting lines indicate GMs and GMNs, respectively
