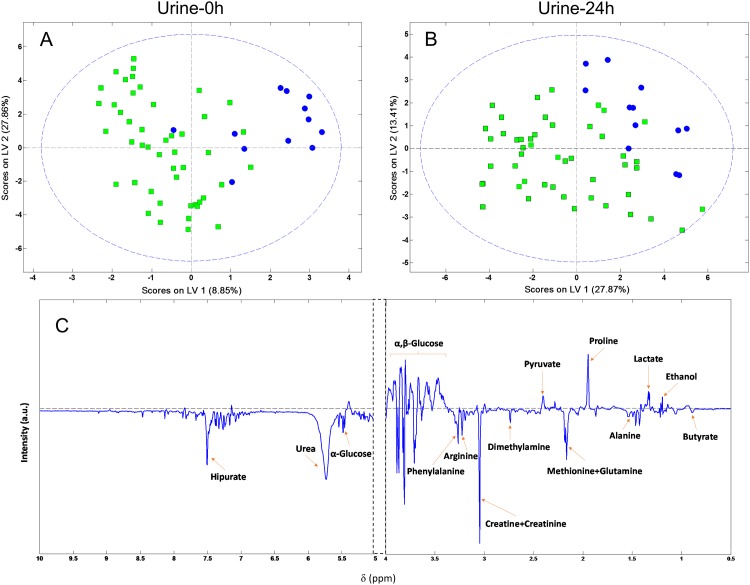
Fig 1. PLS-DA score plot for discrimination between survivor (open squares) and non-survivor patients (black circles).
(A) PLS-DA score plot constructed with Urine-0h samples obtained at the admission to the ICU. (B) PLS-DA score plot constructed with Urine-24h samples obtained at 24h after admission to the ICU. (C) Loading plot of the PLS-DA score plot constructed with Urine-0h samples.

