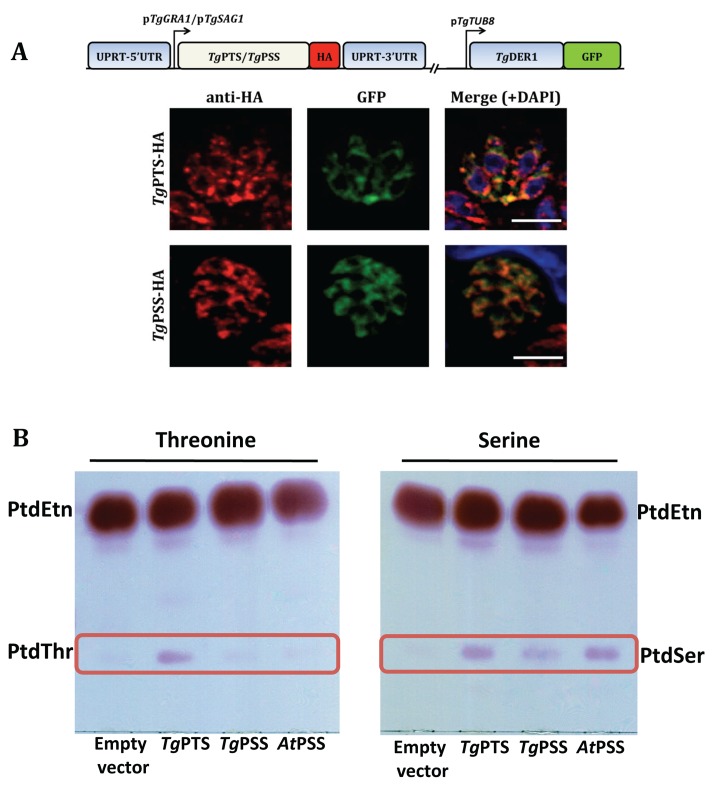
Fig 2. PtdThr and PtdSer are synthesized by PTS and PSS in the ER of T. gondii.
(A) Immunostained images of the HA-tagged PtdThr synthase (TgPTS) and PtdSer synthase (TgPSS) targeted at the uracil phosphoribosyltransferase (UPRT) locus and expressed under the control of the regulatory elements of TgGRA1 or TgSAG1, respectively. Colocalization was done with TgDer1-GFP (ER marker). Yellow fluorescence in the merged panel indicates expression of TgPTS-HA and TgPSS-HA in the ER (bars, 5 μm). No crossfluorescence from green to red channel or vice versa was observed. For costaining with other organelle markers, refer to S5 and S11 Figs. (B) TLC-resolved lipid profiles of E. coli strains harboring the specified expression constructs. To assess the TgPTS and TgPSS activities, ORFs (open reading frames) were cloned into the M15/pREP4 strain of E. coli and expression was induced by IPTG (isopropyl β-D-1-thiogalactopyranoside) in cultures supplemented with 5 mM threonine or serine. Total lipids were resolved in chloroform/methanol/acetate (130:50:20) and visualized by ninhydrin spray.

