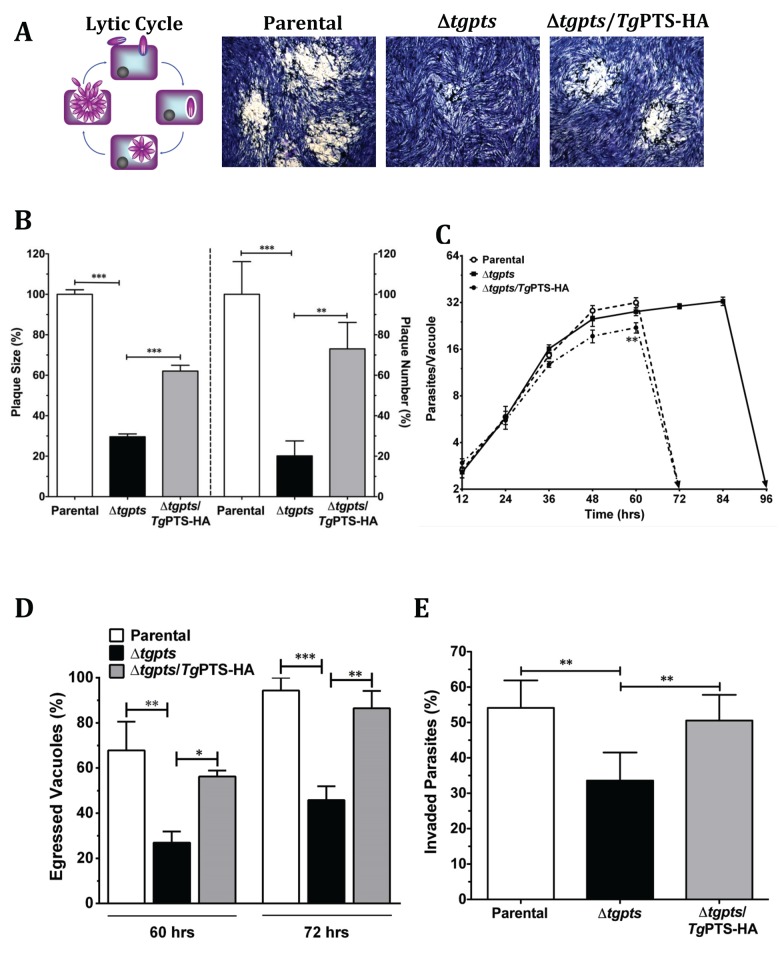
Fig 5. The Δtgpts mutant is defective in egress and invasion but not in replication.
(A) Representative images showing the in vitro growth fitness of the parental, Δtgpts, and PTS-complemented strains by plaque assays, which recapitulate successive lytic cycles of tachyzoites in host cells (see schematics). The mutant was generated as shown in Fig 3. Complemented strain expressed wild-type TgPTS-HA under the control of the TgGRA1 promoter at the TgUPRT gene locus. (B) Quantification of plaque area (left Y-axis) and numbers (right Y-axis). 120–300 plaques of each strain from 7 assays were scored. (C) Intracellular replication of the specified strains, as deduced by the mean number of parasites/vacuoles at different periods. A total of 100–200 vacuoles were analyzed for each strain (n = 4 assays). (D) The natural egress of the indicated parasite strains at 60 and 72 hr postinfection (MOI, 1). In total, 200–300 vacuoles were counted for each strain (n = 4 assays). (E) Invasion rates of the parasite strains (700–1,000 parasites of each strain from 5 assays). The number of egressed vacuoles and invaded parasites were estimated by dual-color staining, as described in Materials and Methods. Graphs in panels B–E indicate the mean ± standard error of the mean (SEM) (*p < 0.05, **p < 0.01, ***p < 0.001). Note that a partial rescue of plaque growth (panel B) in the complemented strain as opposed to near complete recovery of invasion and egress defects in panels D–E is caused by a mild replication defect due to overexpression of PTS in the Δtgpts mutant (panel C).

