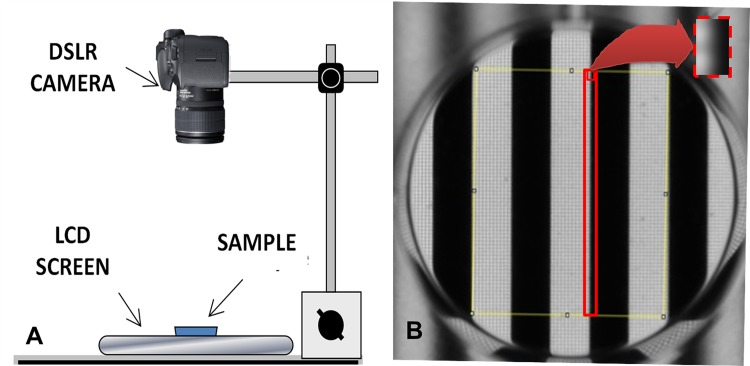
Fig 1. Elements used for performing the photographic-based method.
A: Diagram of the camera and the LCD screen for measuring the transparency of the sample. B: Black-white stripe pattern (3 mm-width stripe each) observed through the petri dish, where a rectangle area (red rectangle in image) of 354 microns-width and 19000 microns-height was selected to perform a plot profile for the blurring assay. The red dot rectangle magnifies this in more detail.

