
Figure 3. SI neuronal response to airflow is encoded by onset latency rather than spike times.
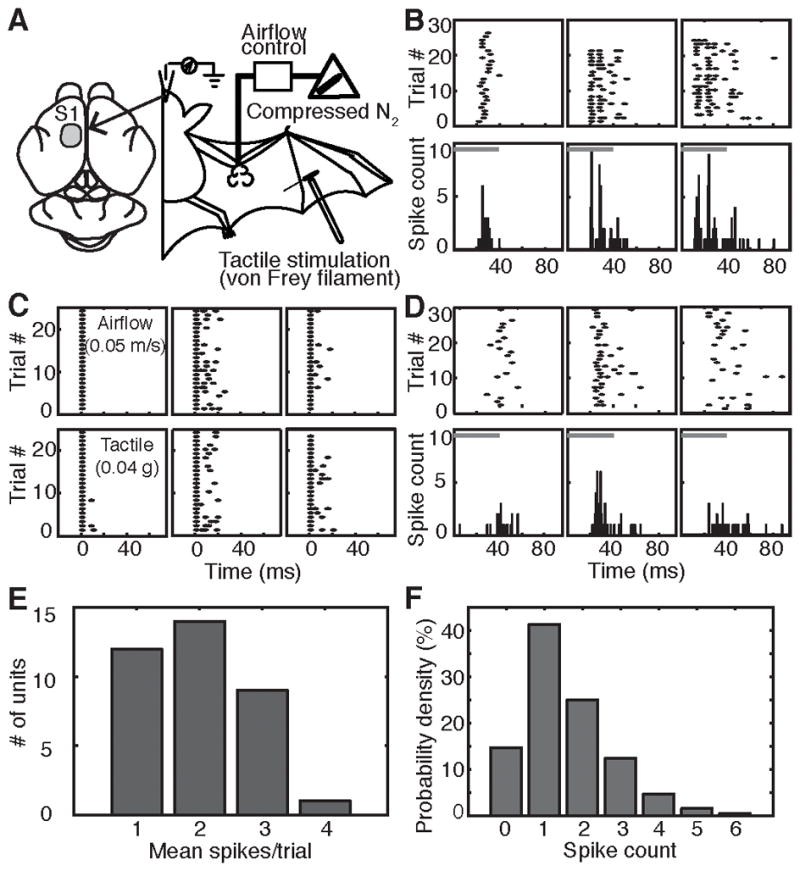
(A) Schematic of in vivo neurophysiological recordings.
(B) Raster plots (top) and post-stimulus time histograms (PSTH, bottom, 1-ms bins) of single-unit responses from three example neurons. Gray bars: stimulus duration.
(C) Responses of three neurons to airflow (top) and tactile stimulation (bottom). Responses were aligned to the first post-stimulus spike.
(D) Airflow responses of three representative neurons recorded under ketamine-xylazine anesthesia.
(E) Distribution of mean spikes/trial across all neurons (N=35) and stimulus conditions. See also Figure S3.
(F) Distribution of number of spikes elicited by air puffs for sampled neurons (N=35) pooled across all stimuli.