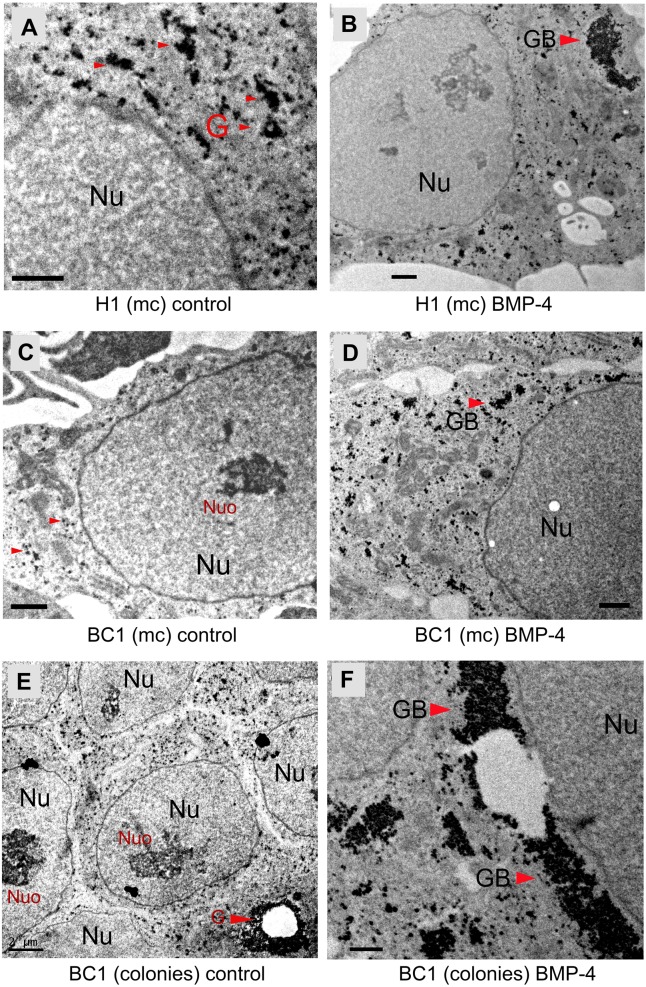
Fig 2. Transmission electron micrograph (TEM) analysis of glycogen synthesis in hPSCs.
(A, C) Representative images of untreated H1 and BC1 cells grown as a non-colony type monolayer (mc) on 2.5% Matrigel. (E) Untreated BC1 cells grown as colonies on Matrigel. (B, D, F) Representative images of hPSCs (left panel) treated with 100 ng/mL of BMP-4. The red colored arrowheads indicate stained glycogen aggregates in the cytoplasm of the cell. Abbreviations: G, glycogen particles or aggregates; GB, glycogen bodies; Nu, the nucleus of the cell; Nuo, the nucleolus of in the nucleus. Scale bars represent 1 μm in A, B, C, D, and F and 2 μm in E.

