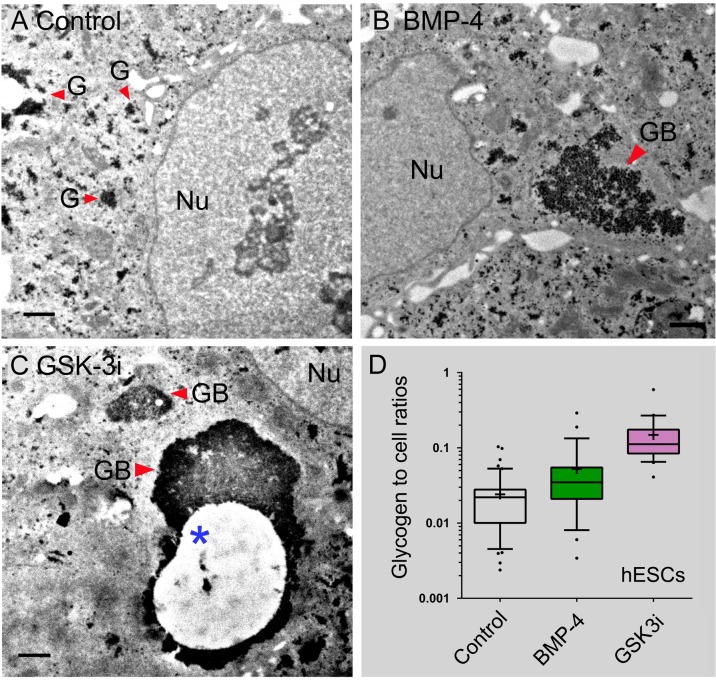
Fig 3. TEM analysis of glycogen synthesis and the formation of glycogen bodies mediated by BMP-4 and GSK-3 inhibition in hESCs.
(A) Glycogen body formation in untreated H1 cells (control). (B) Glycogen body formation in BMP-4 treated H1 cells. (C) Glycogen body formation in GSK3i (CHIR99021)-treated H1cells. The asterisk sign indicates a glycogen defect region in the glycogen body, which likely resulted from dissociation of glycogen aggregates when the specimens were floating in solution during sample preparation. Additional TEM micrographs are available in Supporting Information S1 Fig and S2 Fig. (D) Box-and-Whisker plots of glycogen to cell ratios (with 10–90% percentile) in hESC control (n = 49 cells), BMP-4 treated cells (n = 29), and GSK3i treated cells (n = 22). The statistics included both H1 and H9 cells to increase statistical power. All hESC (i.e., H1 and H9) cells were grown as a non-colony type monolayer (mc) on 2.5% BD Matrigel in meTeSR1 medium and then treated with 100 ng/mL of BMP-4 and 3 μM GSK3i for 48 hours. The red-colored arrowheads indicate the formation of glycogen bodies (GB) in the cytoplasm of the cell. The plus signs (+) in the plots indicate the location of mean values. Abbreviations: GB, glycogen bodies with defined boundaries; Nu, the nucleus of the cells. Scale bars in (A, B) represent 2 μm; and scale bars in (C) represent 1 μm.

