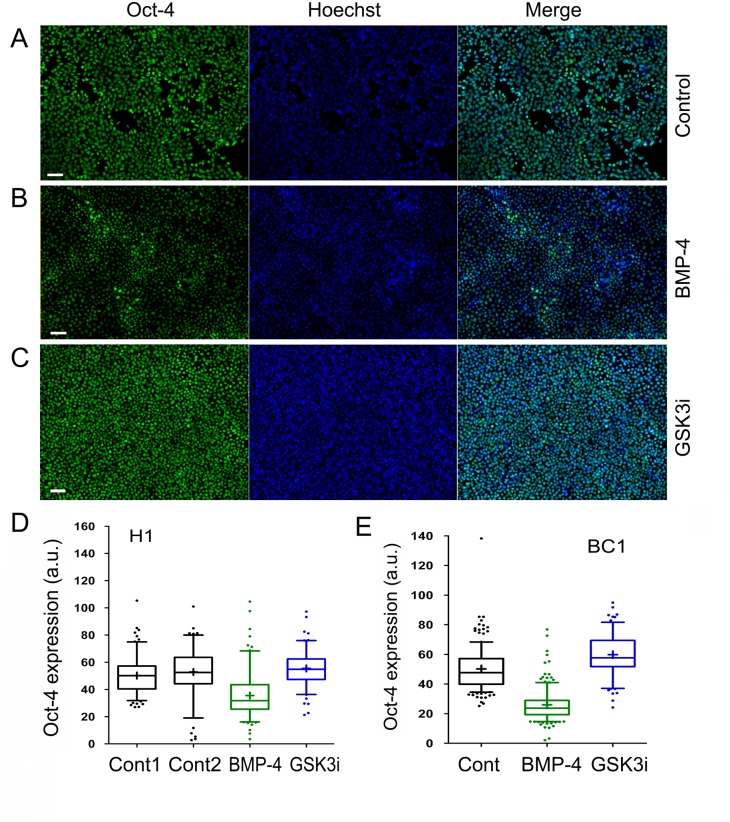
Fig 4. Immunofluorescence analysis of the expression of the pluripotent marker Oct-4 in human pluripotent stem cells (hPSCs).
Oct-4 expression in H1 control cells (A), H1 cells treated with 100 ng/mL of BMP-4 (B), and H1 cells treated with 3 μM GSK3i (CHIR99021) for 48 hours (C). The cellular genomic DNAs were stained by the Hoechst 33342 dye (Hoechst). The images were collected with a fluorescence microscope (Zeiss). (D and E) Box-and-Whisker plots of Oct-4 expression (with 5–95% percentile) in both H1 and BC1 cells under the indicated treatments. Control 2 (Cont2) in D is an additionally untreated control of H1 cells. The plus signs (+) in the plots indicate the location of the mean values determined from 116 to 150 individual cells by the ImageJ program. One of two independent experiments is shown. Scale bars represent 50 μm.

