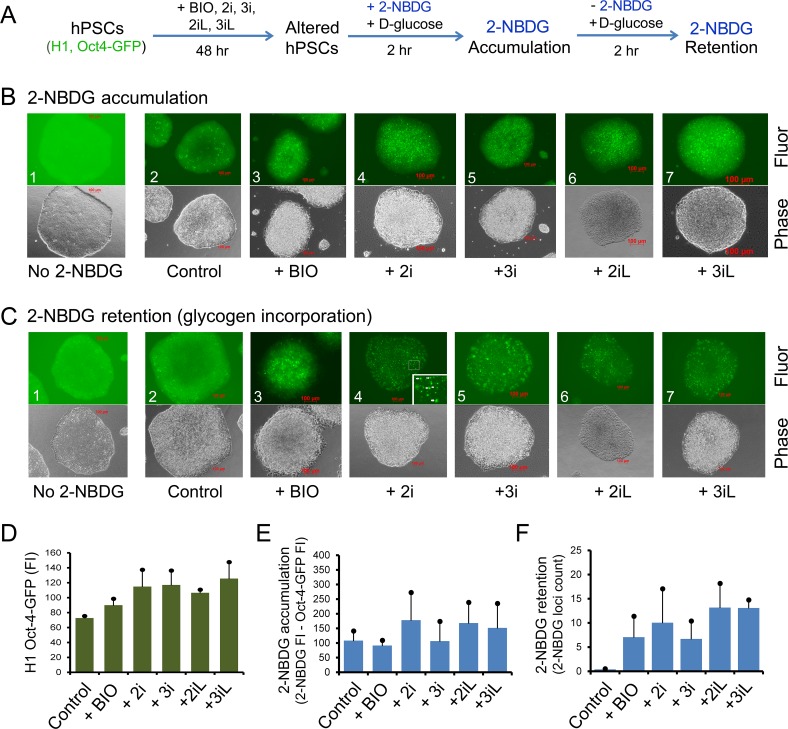
Fig 5. 2-NBDG accumulation and retention in H1 Oct4-EGFP under naïve hPSC growth conditions.
(A) Schema of 2-NBDG accumulation and retention (glycogen labeling) experiments. (B) 2-hour 2-NBDG accumulation in the presence of 10 mM D-glucose. Upper panel: green fluorescence intensity (Fluor) images that include signals from both Oct4-EGFP and 2-NBDG. These images were obtained (immediately after replacing with fresh mTeSR1 medium) by non-saturated time-exposure guided by an autoexposure software (Zeiss Inc.). No 2-NBDG indicates fluorescence background images produced from Oct4-EGFP signal without the use of 2-NBDG. The fluorescence intensity was determined by the signal/noise ratio between cellular fluorescence (signal) and background (noise). The fluorescent background in the 2-NBDG control was due to non-saturated auto exposure using the Zeiss Axiovert imaging system. Lower panel: the corresponding phase images of the upper panel. Only brightness was adjusted in phase images (presented in both B and C) to enhance the image presentation in this figure. (C) 2-NBDG retention and glycogen labeling carried out in the presence of 10 mM D-glucose and absence of 2-NBDG. Upper panel: unique fluorescence loci (dots) were derived from 2-NBDG signals as indicated by arrows in the inset of Fig 5C4. Lower panel: the corresponding phase images of the upper panel. (D) Quantitative analysis of Oct4-EGFP signals without the addition of 2-NBDG. (E) Quantitative analysis of 2-NBDG accumulation in Fig 5B. (F) Quantitative analysis of 2-NBDG retention and glycogen labeling by counting 2-NBDG loci as presented in Fig 5C. Columns represent mean fluorescence intensity measured from at least 4 random colonies and bar standard deviations. Abbreviations (depicted sequentially): BIO, 2 μM GSK3i (BIO); 2i, 2 μM BIO + 1 μM MEKi; 3i, 2i + 1 μM BMP4i; 2iL, 2i + 10 ng/mL LIF; 3iL, 3i + 10 ng/mL LIF; 2-NBDG, (2-(N-(7-nitrobenz-2-oxa-1,3-diazol-4-yl)amino)-2-deoxyglucose), a fluorescent glucose derivative, overlapping with EGFP signals. Scale bars represent 100 μm.

