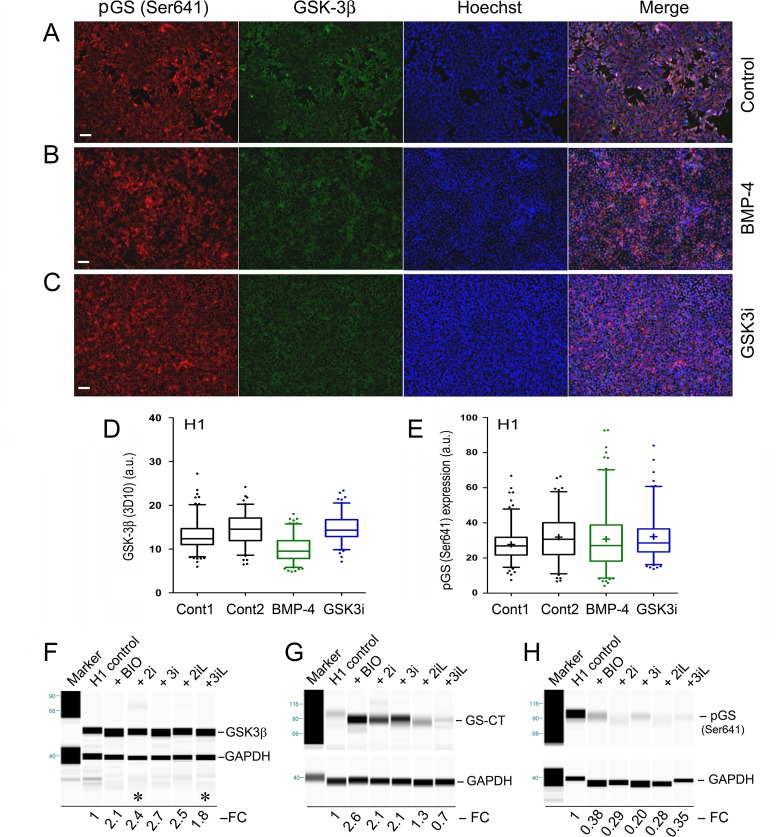
Fig 8. Immunofluorescence analysis of coexpression of the phospho-glycogen synthase (pGS-Ser641) and GSK-3β in hPSCs.
Coexpression of pGS-Ser641 and GSK-3β in H1 control cells (A), H1 cells treated with 100 ng/mL of BMP-4 (B), and 3 μM GSK3i (CHIR99021) (C) for 48 hours. The cellular genomic DNAs were stained by the Hoechst 33342 dye (Hoechst). The images were collected with a fluorescence microscope (Zeiss). (D and E) Box-and-Whisker plots (with 5–95% percentile) of H1 cells under the indicated treatments: Control 2 (i.e., Cont 2) in both D and E is an additionally untreated control of H1 cells. The plus signs (+) in the plots indicate the location of mean values determined from 116 to 150 individual cells by the ImageJ program. One of two independent experiments is shown. Scale bars in the images represent 50 μm. (F-H) Simple Western experiments: H1 Oct4-EGFP (abbreviated as H1) cells were cultured under the monolayer culture condition for 2 passages and treated with naïve growth conditions as indicated for 48 hours. Simple Western was carried out in H1 Oct4-EGFP cell lysates using specific antibodies against GSK-3β, glycogen synthase (C-terminal), and phospho-glycogen synthase at Ser641 (pGS-Ser641). Protein expression was normalized to GAPDH protein control run in the same capillary (lane). Fold changes (FC) of protein expression related to untreated controls were labeled beneath each lane. The lanes marked by asterisk signs (in Fig 8F) were the results obtained from a separate experiment.

