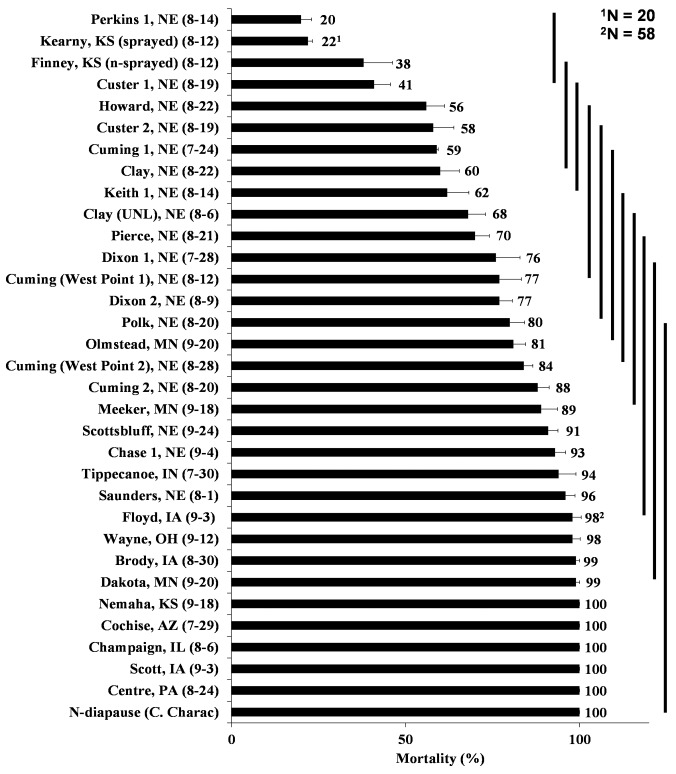
Fig 2. WCR adult mortalities of 32 different field populations from counties throughout the U.S. Corn Belt collected in 2013 (collection date) plus a susceptible laboratory population (non-diapause, Crop Characteristics®) after exposure to diagnostic concentration of bifenthrin (0.77 μg of bifenthrin/vial) corresponding to the LC99 calculated from 10 WCR lab populations.
Means and standard errors are result of 10 replicates (vial), with 10 beetles per vial (unless otherwise stated). Means and standard errors are the result of 10 replicates (vials) with 10 beetles per vial (unless otherwise stated). Population means encompassed by the same solid vertical bars are not significantly different and were compared by least squared means with Tukey adjustment at p ≤ 0.05 using PROC GLIMMIX in SAS 9.3.

