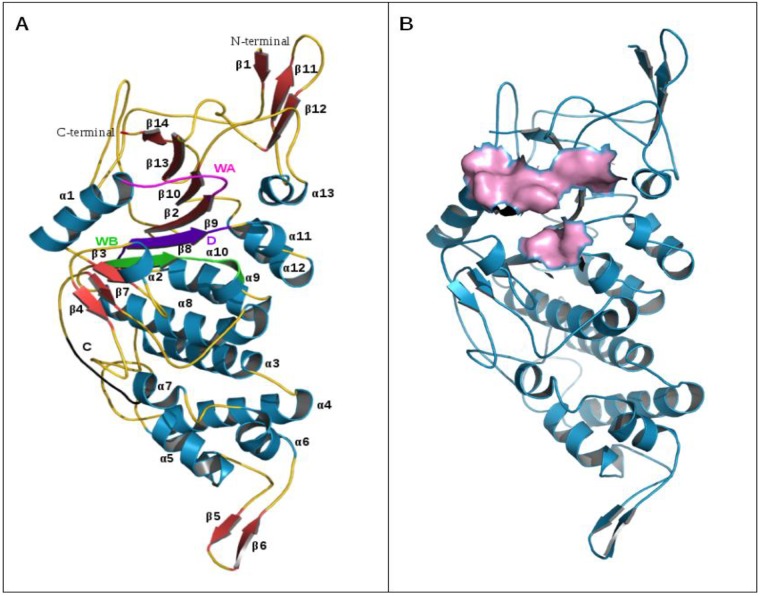
Fig 8. Structure of CTD of CagE.
(A) Structure of CagE (residue cover: 541 to 965, aa). α-helices (α1 to α13) are numbered and shown in dark cyan, β sheets (β1 to β14) are shown in brick red and coils are shown in gold. Motif A (Walker A), motif B (Walker B), motif C and motif D are shown in magenta, green, violet and black respectively. (B) ATP binding site of CagE, (Walker A and Walker B) shown in surface view (Pink).

