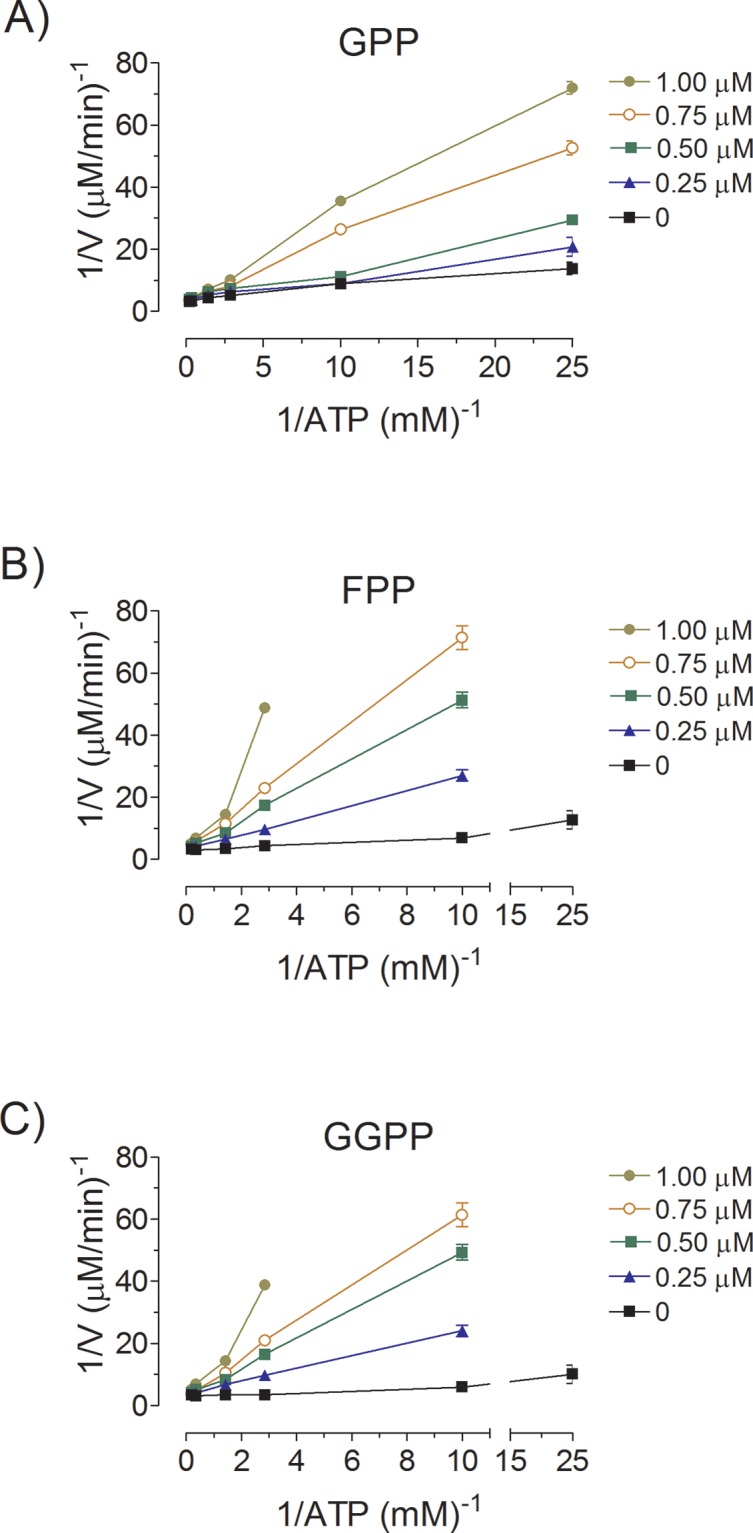
Fig 4. Inhibition of AaMVK activity by GPP (A), FPP (B) and GGPP (C).

The rate of MVK activity was measured at different ATP concentrations, without inhibitors and with several fixed concentration of inhibitors (0–1 μM) and MA (200 μM). Secondary plots of slope versus inhibitor concentration indicated that the Ki values for GPP, FPP and GGPP were respectively 0.55 ± 0.28 μM, 0.44 ± 0.2 μM and 0.93 ± 0.19 μM.
