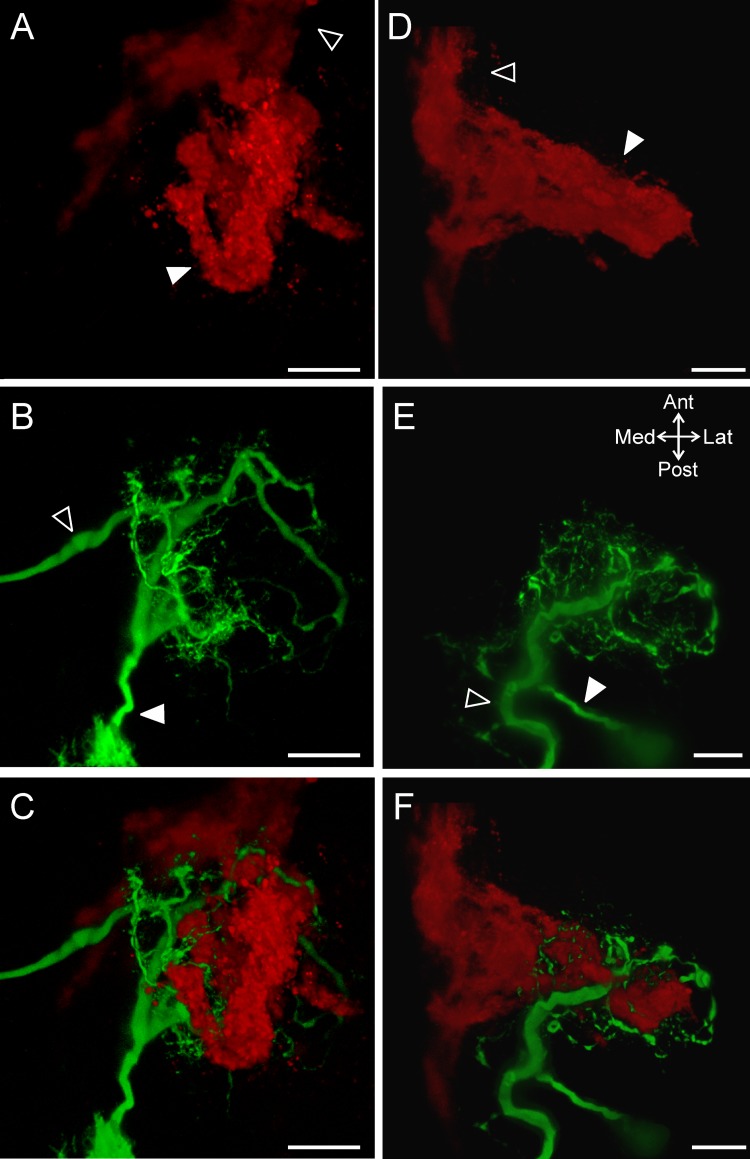
Fig 6. The ACO and MCN1 morphologies are similar within preparations despite variability across preparations.
Volume renderings of z-stacks demonstrate the arborizations of the ACO (A, D) and MCN1 (B, E) and their organization relative to each other (C, F) in two preparations. Both in an example of a round-shaped ACO (A-C) and an elongated ACO (D-F), the MCN1 and ACO arborizations share a similar morphology. Images consist of CabTRP Ia-IR (ACO: red) and intracellular fills of MCN1 with Alexa 568 (green). A-C: 231 slices, 1.0 μm interval; D-F: 246 slices, 1.0 μm interval. Open arrows indicate the MCN1 axon (B, E) and POC (A, D) axon bundle while the filled arrows point to the MCN1 primary neurite (B, E) and the ACO (A, D). Scale bars: 50 μm.

