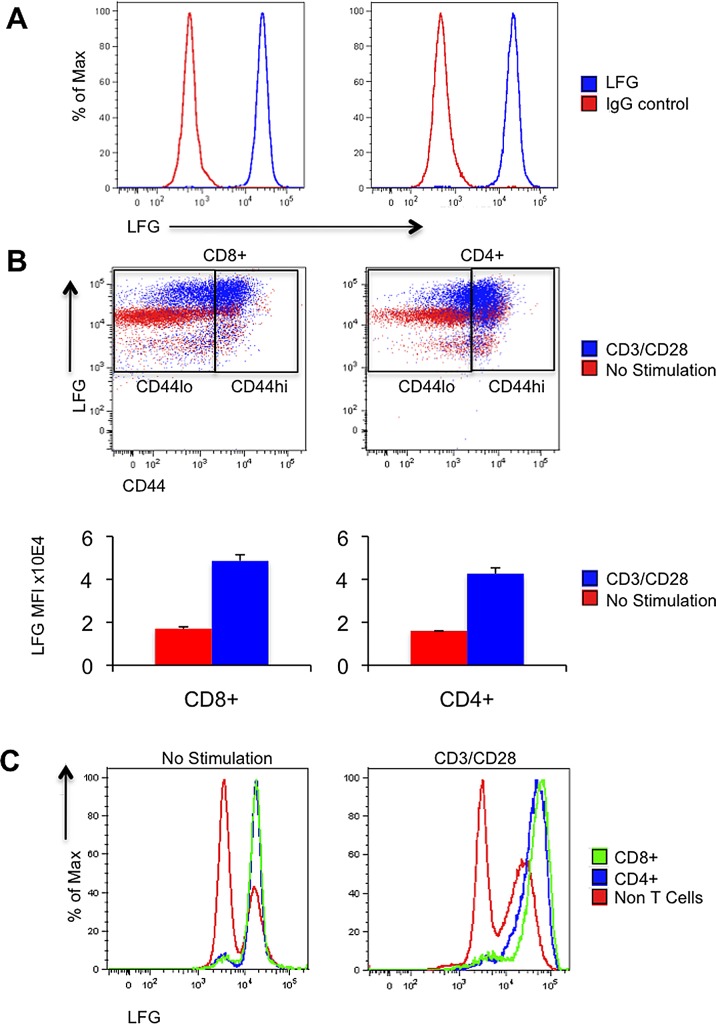
Fig 1. LFG is expressed in T cells and upregulated upon TCR stimulation.
(A) Histograms showing LFG staining in blue compared to IgG control in red. The left panel is gated on CD8 T cells and the right panel on CD4 T cells. (B) FACS plots representing LFG and CD44 expression before (red) or after TCR stimulation by adding anti-CD3/CD28 (blue) in CD8 (left panel) and CD4 (right panel) T cells. The CD44hi/lo gate was created according to the unstimulated condition. The bottom panel represents the values of LFG mean fluorescence intensity for CD8 or CD4 T cells in the no stimulation versus the CD3/CD28 condition. (C) Histograms representing LFG expression in CD4 (blue), CD8 (green) and non-T cells (red) before and after CD3/CD28 stimulation. (n = 4 mice, *p ≤ 0.05, **p ≤ 0.01, ± = SEM).

