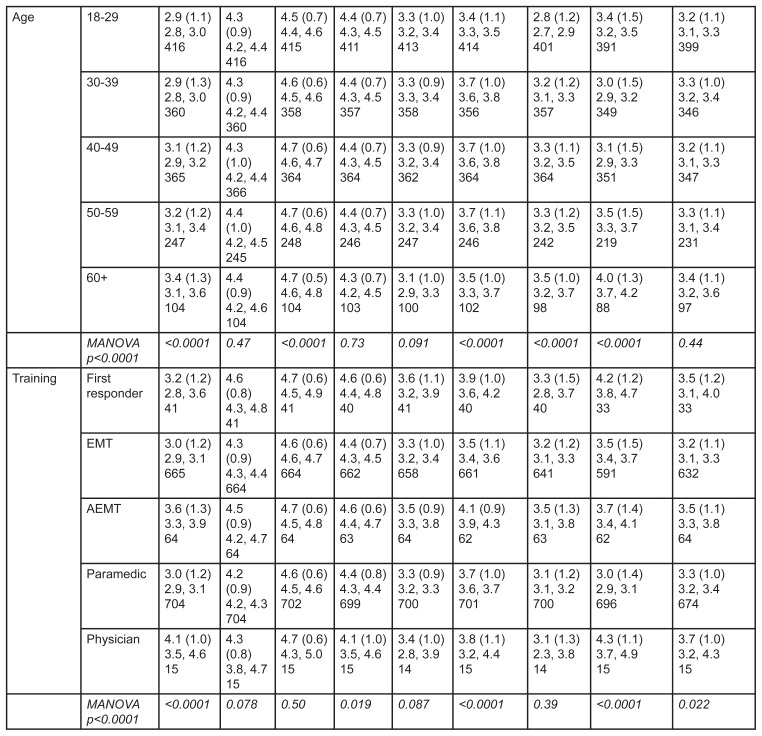
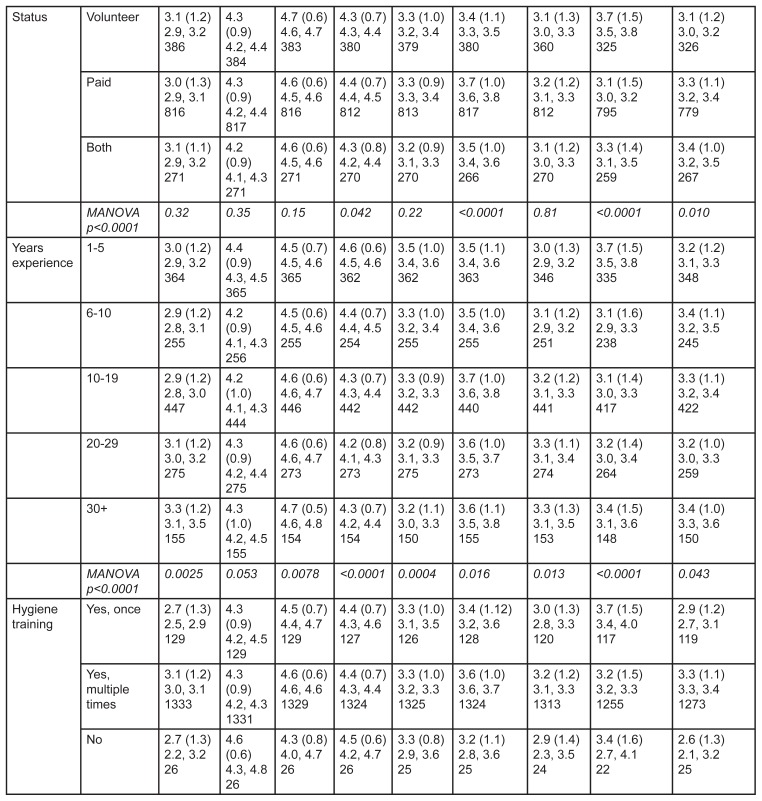
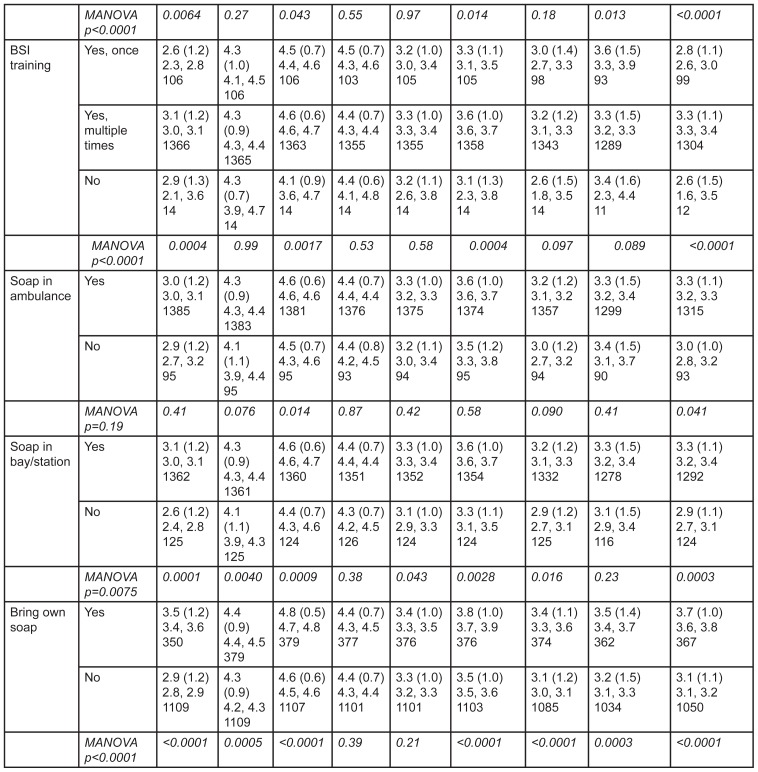
Figure 2.
Mean response (standard deviations) stratified by responder characteristics, followed by the 95% confidence interval in the 2nd line, and the absolute number of responses in the 3rd line, per response category. P-values (in italics) are included to test for differences in means of individual responses based on responder characteristic. Multivariate analysis of variance (MANOVA) p-values test whether there is a measurable collective difference over all responses.
MANOVA, multivariate analysis of variance
EMT, emergency medical technician; AEMT, advanced emergency medical technician; MANOVA, multivariate analysis of variance


